
Listen to the latest audio Schwab Market Perspective.
As the economy has shown continued signs of slowing, investors have begun to think the Federal Reserve might cut short-term interest rates as early as June 2024. It appears that tight Fed policy has had the desired effect on the economy, potentially cooling it enough to bring inflation down to the Fed's target level. That would allow the Fed to take its foot off the brake and begin to loosen monetary policy.
That's why bad news has been welcomed by many stock market investors, and why 10-year Treasury bond yields have dropped sharply in recent weeks. We believe if bond market volatility and yields continue to decline, it would be supportive for the stock market.
Meanwhile, the global economy got two potential shocks in October—the Israel-Hamas war and the Bank of Japan's change to its yield-curve-control policy—but we believe neither will suddenly or materially worsen the currently sluggish global economic and market environment.
U.S. stocks and economy: Good or bad news?
Within the United States, a dominant theme since the Federal Reserve started hiking interest rates last year has been whether good economic news translates to bad stock market news—meaning, whether too-strong data would force the central bank to tighten policy even further, putting downward pressure on stocks. While no relationship is perfect, it's plausible that a tight labor market and stronger-than-expected consumer spending (particularly on services) have helped keep upward pressure on interest rates—so much so that their spike from late summer throughout the fall led to the S&P 500® index's largest correction this year.
Yet, as we've pointed out many times, bad news when it comes to economic data is mostly in the eye of the beholder these days. Even within the October jobs report, there were plenty of details to be both optimistic and pessimistic about. For those in the latter camp, one could point to the unemployment rate's 0.5-percentage-point increase over the past six months. Other than in the early 1950s, we've never seen that large an increase without the economy already being in a recession.
Unemployment rate flashes recession signal
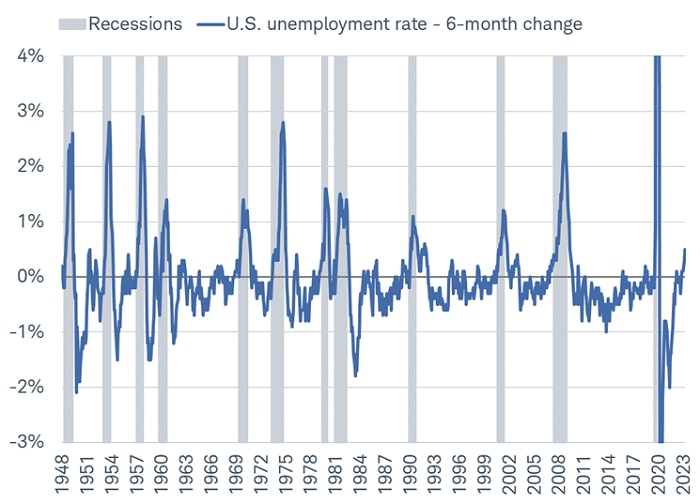
Source: Charles Schwab, Bloomberg, Bureau of Labor Statistics, as of 10/31/2023.
Y-axis is truncated for visual purposes.
The indications of a softening labor market have been viewed favorably by stock market bulls, not least because—in recent months—tighter (and stronger) labor data likely have been a factor in pushing Treasury yields higher, which has coincided with weakness in the stock market. As shown in the chart below, the rolling 30-day correlation between changes in the S&P 500 index and the 10-year U.S. Treasury yield is still in negative territory. That likely means (all else being equal) that a reduction in bond market volatility and continued move lower in Treasury yields would be supportive for stocks in the near term.
Bond yields fighting with stocks
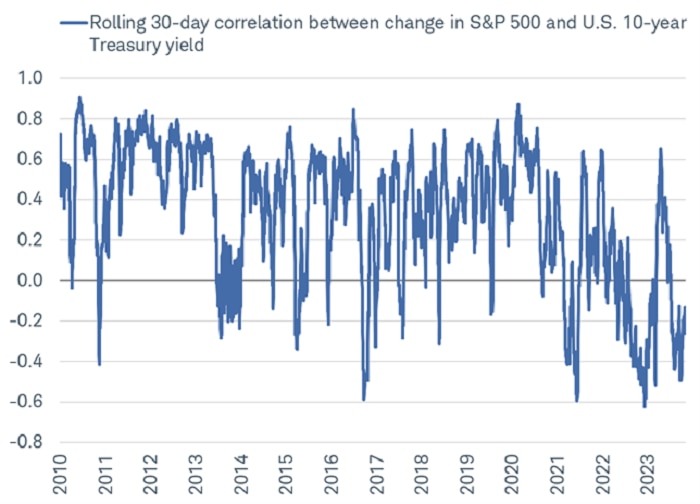
Source: Charles Schwab, Bloomberg, as of 11/3/2023.
Correlation shows the strength of a relationship between two variables and is expressed numerically by the correlation coefficient. The correlation coefficient's values range between 1.0 (perfect positive correlation) and -1.0 (perfect negative correlation). Past performance is no guarantee of future results.
Also supportive is the investor sentiment backdrop, which has turned decisively pessimistic since the summer. As you can see in the chart below, the Crowd Sentiment Poll (CSP) from Ned Davis Research has fallen into "extreme pessimism" territory. At extremes, pessimistic investor sentiment can be a bullish indicator.
Investors not feeling well
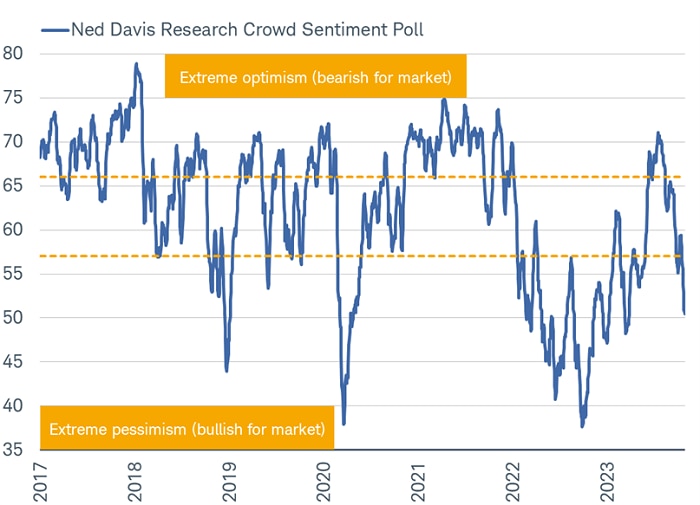
Source: Charles Schwab, ©Copyright 2023 Ned Davis Research, Inc.
Further distribution prohibited without prior permission. All Rights Reserved. See NDR Disclaimer at www.ndr.com/copyright.html. For data vendor disclaimers refer to www.ndr.com/vendorinfo/.
When analyzing sentiment and market performance, however, there are two important caveats worth noting. First, history shows that the best zone for stock market gains is when the CSP is reversing from its current level back above a value of 57 (the bottom yellow dotted line in the chart). Second, pessimistic sentiment in and of itself is not a catalyst for the market to move higher. As mentioned, we think a turn lower in Treasury yields likely would help propel stocks higher, but there needs to be eventual support from an improvement in stock market breadth. Through the end of October, that wasn't yet the case, but investors should keep an eye out for potential outperformance from the "average stock," small caps, and cyclically oriented sectors like banks.
Fixed income: What happened to "higher for longer"?
After climbing by more than 100 basis points (or one percentage point) since late summer, Treasury yields plummeted in early November. Ten-year Treasury yields dropped from a high of 5.02% to less than 4.50% in less than two weeks (before rebounding to the 4.65% area) as investors reacted to signs of slowing economic growth and easing inflation pressures. The market is now pricing in the potential for the Federal Reserve to start cutting interest rates as early as June 2024, with a total of 100 basis points of cuts now expected by the end of next year—double what was expected only a few weeks ago.
Expectations for rate cuts accelerated after the October unemployment report
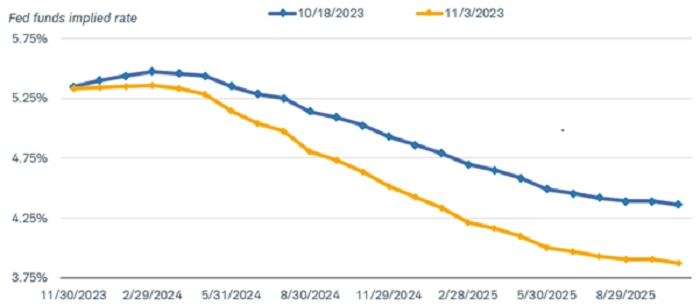
Source: Bloomberg.
Market estimate of the federal funds rate using the Fed Funds Futures Implied Rate (FFX3 COMB Comdty). As of 10/18/2023 and 11/3/2023, respectively.
There were several catalysts for the bond market rally. Since the summer, a constellation of factors had combined to send yields to cyclical highs. Strong third-quarter gross domestic product (GDP) growth on the back of resilient consumer spending and employment, rising uncertainty about the potential for an end to the Fed's rate-hiking cycle, and worries about increasing issuance of Treasury bonds combined to create a summer surge in yields. Bond market sentiment was heavily bearish.
However, since late October the economic data have shown that the preconditions for the Fed to stop hiking interest rates were emerging. The economy is slowing in response to tightening financial conditions, the labor market is loosening, and inflation is heading lower.
For the Federal Reserve, the most important indicator is inflation. The news there has been encouraging as well. The metric that the Fed uses as its benchmark—the deflator for personal consumption expenditures less food and energy (core PCE) has slowed to a 3.7% year/year pace. That is still far from the Fed's 2% target, but it is consistent with its forecast for year-end inflation in 2023. Moreover, it has been decelerating with month-to-month readings declining most of this year. On an annualized, three-month change basis, core PCE rose by just 2.5% in September.
Inflation is nearing the Fed's 2% target
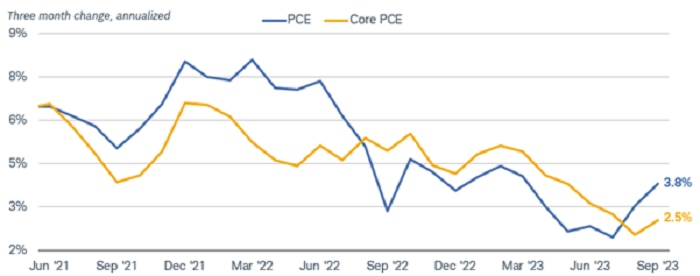
Source: Bloomberg, using monthly data as of 9/30/2023.
US Personal Consumption Expenditures Chain Type Price Index SA (PCE DEF Index) and US Personal Consumption Expenditure Core Price Index MoM SA (PCE CORE Index). Personal Consumption Expenditures (PCE) includes a measure of consumer spending on goods and services among households in the U.S. The PCE is used as a mechanism to gauge how much earned income of households is being spent on current consumption for various goods and services. Core PCE excludes food and energy prices, which tend to be volatile.
Given the progress made toward its goals, we agree with the market view that the Fed is unlikely to hike the federal funds rate again in this cycle. The market may be a bit too optimistic about the timing and pace of rate cuts in 2024, but we would not rule out some easing by mid-year if current trends continue. It's worth noting that the Fed still plans to reduce its balance sheet by allowing the bonds it holds to mature—a form of tightening. Consequently, monetary policy will still be exerting a negative influence on the economy into the future, likely keeping inflation in check.
Global stocks and economy: Two shocks
Economic and market cycles tend to progress gradually until hit by a shock, catalyzing rapid change. October saw two such potential shocks, but we believe neither will suddenly or materially worsen the currently sluggish global economic and market environment.
The first was a potential oil shock from the Israel-Hamas war that began on October 7th. As we've seen in other drawn-out conflicts such as those in Ukraine and Syria, the reactions in global stocks, bonds and oil prices have tended to be mild. Primarily, conflicts in the Middle East affect the global economy through oil prices. At this time, oil prices are little changed, closely tracking the average of prior conflicts. We believe a 1% rise is unlikely to prompt any kind of shock to the global economy.
Short-term impact of various geopolitical events on Brent crude oil prices
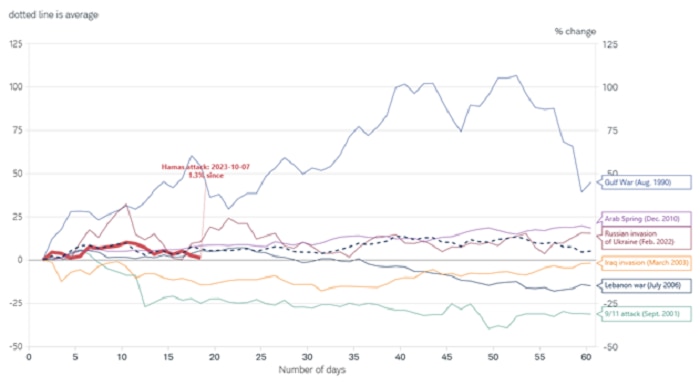
Source: Charles Schwab, Intercontinental Exchange (ICE) data, Macrobond as of 11/1/2023.
Past performance is no guarantee of future results.
The second potential shock is tied to last week's announcement by the Bank of Japan (BOJ), which we had previewed in our February commentary, Are You Focusing on the Wrong Central Bank? The BOJ has officially ended its commitment to buy an unlimited amount of Japanese government bonds in an effort to cap the 10-year yield at 1%, a policy referred to as yield curve control (YCC). In response, the 10-year Japanese government bond yield rose. But, in a seemingly contrary move, the yen weakened against the U.S. dollar, because currencies tend to move on differences in inflation-adjusted—or "real"—yields, not nominal yields. Because the BOJ raised its inflation outlook at the same time it cancelled its unlimited purchasing, inflation pressures weighed on both the real yield and the yen. Should U.S. real yields rise at a faster pace than Japanese yields in the near term, as they have been doing lately, we might expect continued pressure on the yen. In the longer term, the potential for higher real Japanese yields and lower U.S. real yields are potential positives for the Japanese currency.
Japan: Range for yield curve control of 10-year yield and the yen
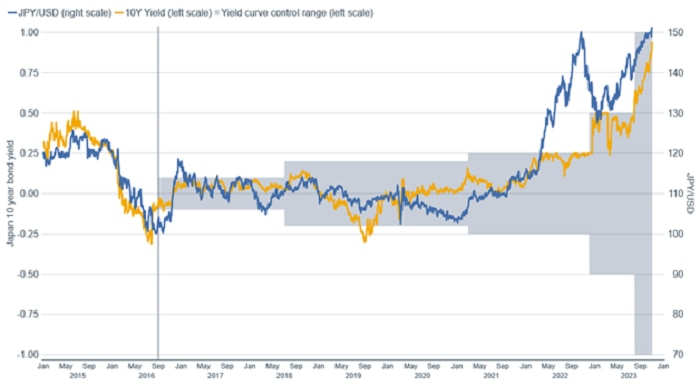
Source: Charles Schwab, Macrobond data as of 11/1/2023.
Gray vertical line represents the date that the BOJ implemented yield curve control in September 2016. Past performance is no guarantee of future results.
Why might this change in BOJ policy matter to investors? If the change at the BOJ leads to higher real yields and yen appreciation, Japan's net capital outflows could turn into sizeable inflows. This potentially could lead to a liquidity shock if capital is rapidly repatriated to Japan. However, we see BOJ policy unfolding as a gradual and managed rise in interest rates in Japan, unlikely to prompt destabilizing capital flows or a surge in the yen, as evidenced by the initial reaction to last week's announcement.
Although these two potential shocks are unlikely to change the pace of the global economy, overall the pace of global growth isn't good, as last week's third-quarter GDP data made clear. Economies more exposed to manufacturing and trade have been among the weakest, like Germany, which has had negative GDP growth in four of the past five quarters. Economies that are more services-focused, like France, have fared better. France has not seen a negative quarter of GDP during the past six quarters. Overall, the global picture is one of stagnant growth, but not stagflation—the term for stagnant growth coupled with high inflation. Notably, sluggish growth has actually helped inflation recede to 2.9% in Europe, close to the European Central Bank's target of 2%. The global economic backdrop is more of a "recession" in terms of the duration of economic weakness rather than in its depth—resulting in the many quarters of weakness among most of the Group of Seven countries that may extend into 2024.
Real GDP for Group of Seven countries (not annualized)
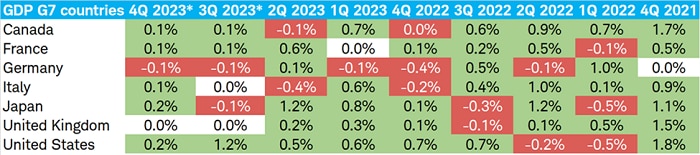
Source: Charles Schwab, Macrobond data as of 11/1/2023.
*Bloomberg-tracked economists' consensus forecasts for Q3 and Q4 (Q3 actuals for U.S., Germany, Italy and France).
Kevin Gordon, Senior Investment Strategist, contributed to this report.
Get Schwab's view on markets and economy.
More from Charles Schwab
Opening Market Update
Closing Market Update
The Truth About Corporate Stock Earnings Estimates
Related topics
The information provided here is for general informational purposes only and should not be considered an individualized recommendation or personalized investment advice. All expressions of opinion are subject to changes without notice in reaction to shifting market, economic, and geopolitical conditions.
Data herein is obtained from what are considered reliable sources; however, its accuracy, completeness, or reliability cannot be guaranteed. Supporting documentation for any claims or statistical information is available upon request.
Past performance is no guarantee of future results, and the opinions presented cannot be viewed as an indicator of future performance.
Investing involves risk, including loss of principal.
Fixed income securities are subject to increased loss of principal during periods of rising interest rates. Fixed income investments are subject to various other risks including changes in credit quality, market valuations, liquidity, prepayments, early redemption, corporate events, tax ramifications, and other factors. Lower rated securities are subject to greater credit risk, default risk, and liquidity risk.
International investments involve additional risks, which include differences in financial accounting standards, currency fluctuations, geopolitical risk, foreign taxes and regulations, and the potential for illiquid markets. Investing in emerging markets may accentuate these risks.
Commodity-related products carry a high level of risk and are not suitable for all investors. Commodity-related products may be extremely volatile, illiquid and can be significantly affected by underlying commodity prices, world events, import controls, worldwide competition, government regulations, and economic conditions.
Currencies are speculative, very volatile and are not suitable for all investors.
Small cap investments are subject to greater volatility than those in other asset categories.
The policy analysis provided by the Charles Schwab & Co., Inc., does not constitute and should not be interpreted as an endorsement of any political party.
Forecasts contained herein are for illustrative purposes only, may be based upon proprietary research and are developed through analysis of historical public data.
Indexes are unmanaged, do not incur management fees, costs and expenses, and cannot be invested in directly. For additional information, please see schwab.com/indexdefinitions.
The Schwab Center for Financial Research is a division of Charles Schwab & Co., Inc.
Source: Bloomberg Index Services Limited. BLOOMBERG® is a trademark and service mark of Bloomberg Finance L.P. and its affiliates (collectively "Bloomberg"). Bloomberg or Bloomberg's licensors own all proprietary rights in the Bloomberg Indices. Neither Bloomberg nor Bloomberg’s licensors approves or endorses this material, or guarantees the accuracy or completeness of any information herein, or makes any warranty, express or implied, as to the results to be obtained therefrom and, to the maximum extent allowed by law, neither shall have any liability or responsibility for injury or damages arising in connection therewith.
1123-3P5Z