Is the Federal Reserve finished? There are economic signs to support and to oppose the proposition that the Fed's rate-hike cycle has done its job—slowing the economy enough to cool inflation—and can be ended. Whether the central bank still sees the need for another increase is a key question as we head into the final months of the year. We tend to think it won't, but there has been enough uncertainty about it to cause volatility in both stock and bond markets.
For context, recall that the Fed has raised the federal funds rate target1 to 5.25% to 5.5% from near zero in a little more than a year's time. The impact of that policy tightening is showing up in economic data and lower inflation. Notably, the labor market, which is a key factor for the Fed in setting policy, is showing softness. Job openings have declined, hiring has slowed, wage growth is trending lower and the unemployment rate has ticked higher. The monthly pace of hiring has fallen to 150,000 on a rolling three-month basis, compared with more than 300,000 earlier this year. Wage growth is also slowing down, and the unemployment rate rose in August to 3.8%, the highest level since February 2022.
Job growth has slowed
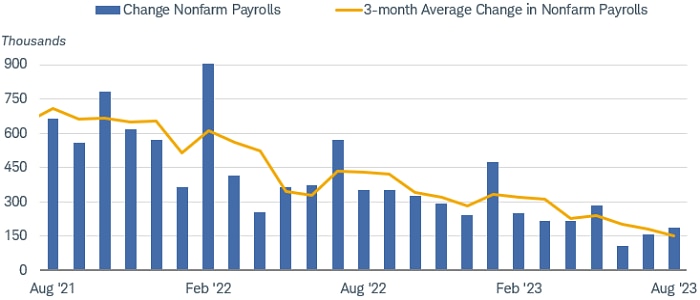
Source: Bloomberg, U.S. Bureau of Labor Statistics, monthly data as of 8/31/2023.
Chart shows the month-over-month change in U.S. employees on nonfarm payrolls, as reported in the Bureau of Labor Statistics' monthly Employment Situation Summary.
Moreover, inflation is slowing. The Fed's preferred inflation gauge, the "core" Personal Consumption Expenditures (PCE) Price Index2 (core means it excludes volatile food and energy prices) rose by just 0.2% in July. On a three-month annualized basis, core PCE was up 2.9% year-over-year in July—closer to, but still above the Fed's 2% inflation target.
U.S. stocks and economy: Keep an eye on market breadth
Stock market performance has become "top-heavy" at points during the past couple of years, with gains led by a handful of large stocks. It's not uncommon for the largest-cap stocks to dominate performance in a market-cap-weighted index like the S&P 500® index, in which a handful of stocks have an outsized weighting. But it's a troubling sign when the majority of member stocks are underperforming the overall index—in 2021, for example, it correctly signaled that the S&P 500 rally was losing steam. You can see the pattern in the chart below, which compares the percentage of S&P 500 stocks trading above their 200-day moving averages versus the performance of the S&P 500 index itself. Market breadth waned throughout 2021, and by early 2022 the S&P 500 had reversed its uptrend. Although market breadth improved in the first half of 2023, the two indicators diverged again in late summer.
S&P 500 breadth has not matched performance lately
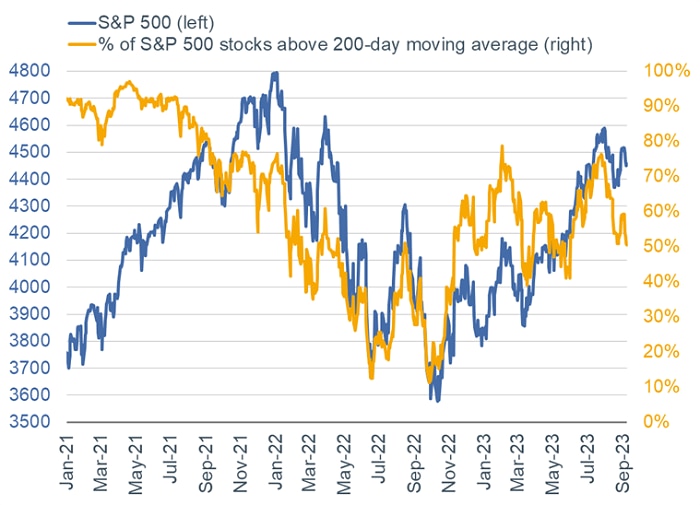
Source: Charles Schwab, Bloomberg, as of 9/8/2023.
The 200-day moving average calculates the simple average of the closing price of a stock over the most recent 200 trading sessions. The line drawn from those numbers shows the trend of a stock over a long duration. Indexes are unmanaged, do not incur management fees, costs and expenses and cannot be invested in directly. Past performance is no guarantee of future results.
Fixed income: Longer-term Treasury yields may be near peak
Figuring out which direction Treasury yields will take has not been easy lately. Short-term yields remain near rate-hike-cycle highs, reflecting the potential for another Fed rate hike before the end of the year. Meanwhile, intermediate- to long-term bond yields (which move inversely to prices) have been trading in a broad range over the past month—any sign that the economy was growing at more than a modest pace has sent yields higher, while cooling inflation pressures has sent them lower.
Over the long run the declining trend in inflation and softness in economic growth should allow yields to fall from current levels later this year and into 2024—although it's likely to be a bumpy ride, given the crosscurrents in the market.
Moreover, we believe that the Fed is done hiking rates in this cycle. In the past four cycles, 10-year Treasury yields generally peaked before the last rate hike and then tended to trend lower. It's unusual for long-term yields to peak after the last Fed rate hike. It hasn't happened since the 1970s and early 1980s.
Treasury yields typically peak before the final rate hike of the cycle
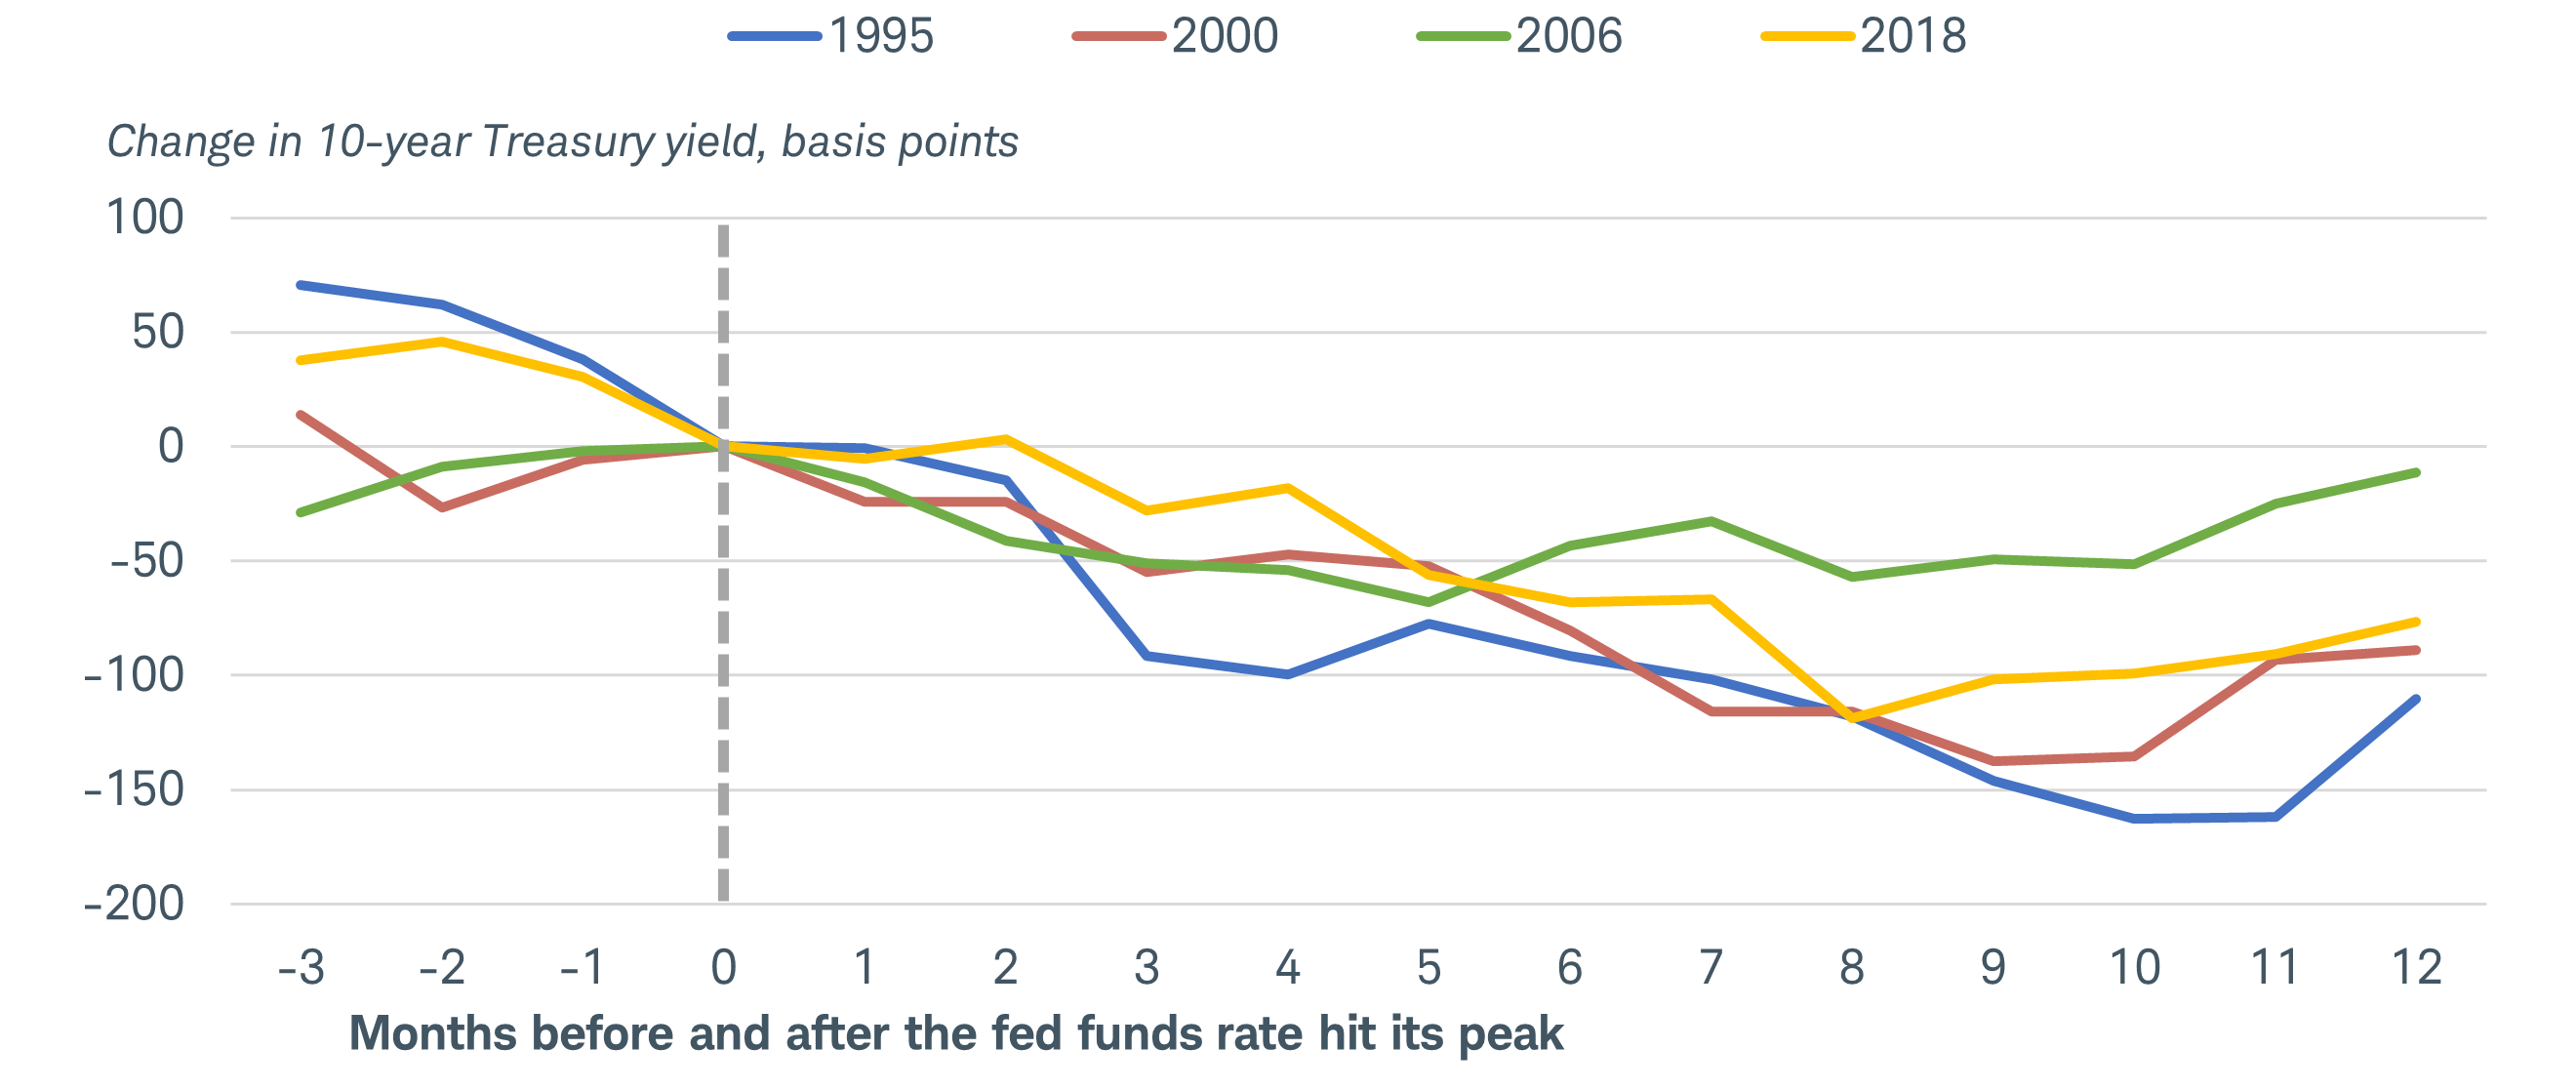
Source: Schwab Center for Financial Research, Bloomberg, as of 9/6/2023.
US Generic Govt 10 Yr (USGG10YR Index) and Federal Funds Target Rate - Upper Bound (FDTR Index). Change in 10-year Treasury yield using monthly data, with the peak federal funds rate at month zero using the following months: February 1995, May 2000, June 2006, and December 2018. Past performance is no guarantee of future results.
It's very difficult to time the interest rate market. Waiting in short-duration bonds until the Fed is done hiking rates increases reinvestment risk. Yields are at the highest levels in a decade and we don't expect them to stay that high for long.
Global stocks and economy: China and Europe
China has been having a tough year, as a surge in first quarter economic growth was followed by a stall in the second quarter. Our analysis of China's national data shows a country mired in deflation, plunging exports, youth unemployment above 20%, a consumer pullback and an unstable property sector that has led to developers missing bond payments and a trust company failing to repay investors.
That's a real problem for China, as the property market is estimated to have contributed as much as 29% to its gross domestic product (GDP) in recent years. Because property makes up about 70% of wealth for Chinese households (according to analysis of data from China's National Bureau of Statistics), worries about the housing market appear to be eroding overall consumer confidence and the pace of spending on goods.
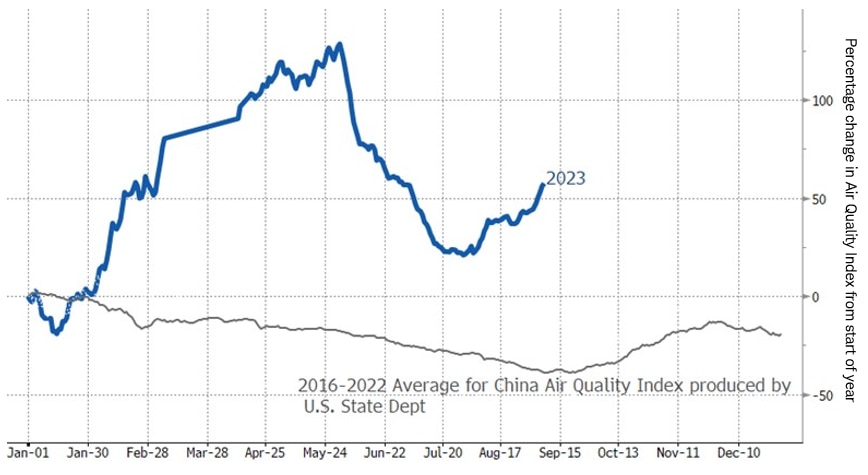
In response, China has enacted incremental and targeted stimulus measures that may be having some success. Air pollution, measured by U.S. consulates in China, offers a real-time measure of manufacturing and travel in the country—pollution rises along with economic activity. In recent weeks, air quality in China's capital worsened as new stimulus measures were enacted after the July Politburo meeting, reversing some of the decline in emissions during the second quarter as the economy stalled.
Air quality index suggests recent stimulus measures may be having an impact
Source: Charles Schwab, U.S. State Department, Bloomberg data as of 9/7/2023.
The Average for China Air Quality Index (AQI) is published by the U.S. Department of State and developed by the U.S. Environmental Protection Agency (EPA). EPA converts readings of particulate matter that is 2.5 micrometers or smaller (PM 2.5) via formula into air quality index value. The blue line reflects the change in the index since the beginning of January 2023, shown in 4-week increments (to reflect seasonal variations). The gray line shows the average change between 2016 and 2022. A rising line represents worsening air pollution, and a falling line represents improving air pollution.
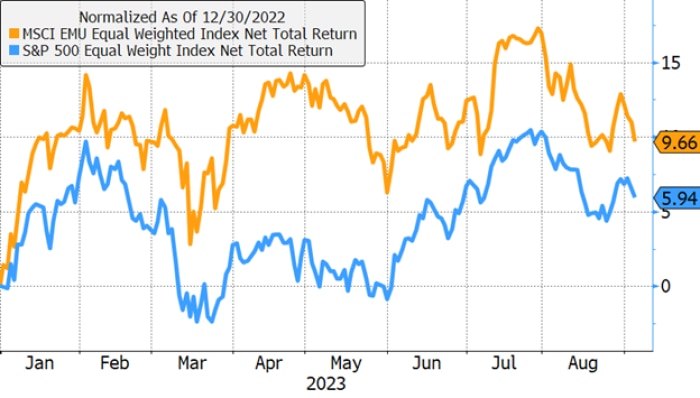
Meanwhile, European economic indicators have been disappointingly weak since April, to the point that the economy may be back in recession. Yet European equity markets do not seem to reflect this extended string of disappointing data. While the average European stock, measured by the equal-weighted MSCI EMU Index, is down from this year's peak at the end of July, it has outperformed the average U.S. stock so far this year, despite a big difference in economic momentum.
Europe's stocks outperforming
Source: Charles Schwab, Bloomberg data as of 9/6/2023.
EMU = European Monetary Union (eurozone). The MSCI Europe (or EMU) Equal Weighted Index represents an alternative to its market-cap-weighted parent index, the MSCI Europe Index. The MSCI EMU Equal Weighted index includes the same constituents as its parent (large and mid-cap securities across 15 developed-market countries in Europe). However, at each quarterly rebalance date, all index constituents are weighted equally, effectively removing the influence of each constituent's current price (high or low).
The S&P 500® Equal Weight Index is the equal-weight version of the S&P 500. The index includes the same constituents as its capitalization-weighted parent, but each company in the S&P 500 Equal Weight Index is allocated a fixed weight of the index total at each quarterly rebalance.
Total return is the actual rate of return of an investment or a pool of investments over a period. Total return includes interest, capital gains, dividends, and realized distributions.
Both indexes measured in U.S. dollars. Indexes are unmanaged, do not incur management fees, costs and expenses, and cannot be invested in directly. Past performance is not guarantee of future results.
Investor expectations for eurozone growth may already be so low that negative surprises are now expected and no longer seem to hurt stock prices. Investors willing to look beyond the current weakness could start to drive up price-to-earnings ratios from these depressed levels as they anticipate the next upswing. Counterintuitively, a catalyst could include more disappointing economic data if that data were considered weak enough to persuade the European Central Bank to halt its unwinding of quantitative easing that began in March and start cutting interest rates.
What investors can do now
As we've been saying for a while, investors would do well to focus on companies with high-quality attributes (or "factors"), such as strong profit margins and upward revisions to earnings estimates. These companies may be better positioned to weather potential ups and downs.
For fixed income investors, remember that it's very difficult to time the interest rate market. Waiting in short-duration bonds until the Fed is done hiking rates increases reinvestment risk—that is, the risk that you'll have to reinvest maturing securities at lower yields. Yields are at the highest levels in a decade and we don't expect them to stay that high for long. Consider adding longer-duration bonds or bond funds to your portfolio.
Meanwhile, investors should check their international allocations. Those who prefer to stick with U.S. stocks, or who have let their foreign allocations dwindle after years of international underperformance, may be missing out on more than half the global market … and the returning strength of foreign stocks, which are having their moment after years of underperformance compared with U.S. stocks. Appropriate diversification, aligned with your goals and risk appetite, is a good idea in any market.
1 The federal funds rate target range, set by the Federal Open Market Committee, is the rate at which commercial banks borrow and lend their excess reserves to each other overnight. Because it can influence other short-term interest rates (such as those on consumer loans and credit cards) the federal funds rate is among the tools the Fed uses to either stimulate or cool economic growth.
2 Both the PCE Price Index and the PCE Price Index Excluding Food and Energy, also known as the core PCE price index, are released by the U.S. Department of Commerce's Bureau of Economic Analysis as part of the monthly Personal Income and Outlays report. The core index makes it easier to see the underlying inflation trend by excluding two categories—food and energy—where prices tend to swing up and down more dramatically and more often than other prices. The core PCE price index is closely watched by the Federal Reserve as it conducts monetary policy.
The information provided here is for general informational purposes only and should not be considered an individualized recommendation or personalized investment advice. The investment strategies mentioned here may not be suitable for everyone. Each investor needs to review an investment strategy for his or her own particular situation before making any investment decision. All expressions of opinion are subject to change without notice in reaction to shifting market conditions. Data contained herein from third-party providers is obtained from what are considered reliable sources. However, its accuracy, completeness, or reliability cannot be guaranteed. Examples provided are for illustrative purposes only and not intended to be reflective of results you can expect to achieve.
Past performance is no guarantee of future results and the opinions presented cannot be viewed as an indicator of future performance.
Investing involves risk including loss of principal.
Diversification strategies do not ensure a profit and do not protect against losses in declining markets.
Fixed income securities are subject to increased loss of principal during periods of rising interest rates. Fixed income investments are subject to various other risks including changes in credit quality, market valuations, liquidity, prepayments, early redemption, corporate events, tax ramifications, and other factors. Lower rated securities are subject to greater credit risk, default risk, and liquidity risk.
International investments involve additional risks, which include differences in financial accounting standards, currency fluctuations, geopolitical risk, foreign taxes and regulations, and the potential for illiquid markets. Investing in emerging markets may accentuate this risk.
The policy analysis provided by the Charles Schwab & Co., Inc., does not constitute and should not be interpreted as an endorsement of any political party.
Schwab does not recommend the use of technical analysis as a sole means of investment research.
Forecasts contained herein are for illustrative purposes only, may be based upon proprietary research and are developed through analysis of historical public data.
Indexes are unmanaged, do not incur management fees, costs, and expenses and cannot be invested in directly. For more information on indexes please see schwab.com/indexdefinitions.
The Schwab Center for Financial Research is a division of Charles Schwab & Co., Inc.
Source: Bloomberg Index Services Limited. BLOOMBERG® is a trademark and service mark of Bloomberg Finance L.P. and its affiliates (collectively "Bloomberg"). Bloomberg or Bloomberg's licensors own all proprietary rights in the Bloomberg Indices. Neither Bloomberg nor Bloomberg's licensors approves or endorses this material, or guarantees the accuracy or completeness of any information herein, or makes any warranty, express or implied, as to the results to be obtained therefrom and, to the maximum extent allowed by law, neither shall have any liability or responsibility for injury or damages arising in connection therewith.
0923-3HPL