
Before breathing a sigh of relief that rate hikes may have ended, investors may want to pause. Further tightening by major central banks still goes on in the form of quantitative tightening, posing an increasing risk to stock markets around the world.
Central banks appear to be ending their interest rate hiking cycles with the Bank of England (BOE) and Swiss National Bank surprising last week with pauses instead of hikes, joining a growing list of central banks that have put further increases on hold. Yet, monetary policy tightening continues with quantitative tightening (QT) underway at most major central banks. QT is the unwinding of quantitative easing (QE), when central banks reverse their former QE program asset purchases by not reinvesting maturing bonds and/or by selling bonds, to reduce the overall size of their balance sheets. During last week's meeting, the BOE Monetary Policy Committee voted 5-4 to leave rates unchanged at 5.25%, but all nine members voted in favor of increasing the pace of quantitative tightening from £80B this year to £100B over the next 12 months.
QE and QT policies impact the stock markets primarily through the phenomenon referred to as the "portfolio rebalancing effect," where investors take more risk in search of return in the markets in response to QE pushing yields lower, or reduce holdings in risky assets when QT drives yields higher and making bonds more attractive. This effect manifested in a sharp rise in the S&P 500 price-to-earnings (PE) ratio during the pandemic-related QE program and its subsequent decline in 2021-22 as the Federal Reserve tapered that QE program, as illustrated in the chart below.
QE and PE in 2020-22
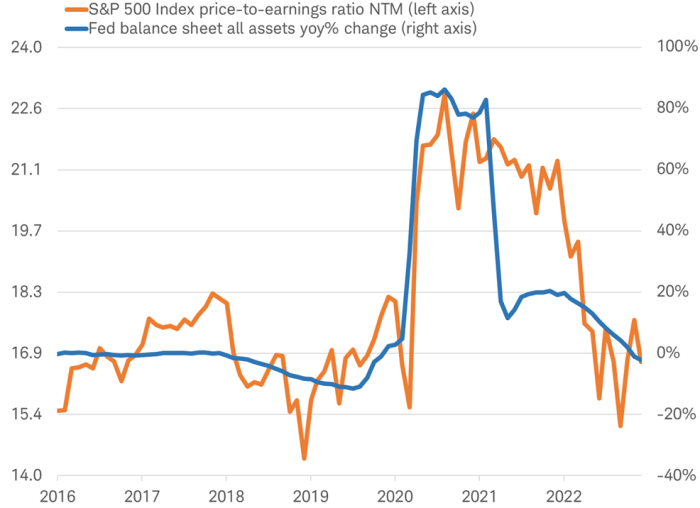
Source: Charles Schwab, FactSet data as of 9/23/2023.
NTM is next 12 months. Forecasts contained herein are for illustrative purposes only, may be based upon proprietary research and are developed through analysis of historical public data. Past performance is no guarantee of future results.
Historically, there have been only two main international experiences of QT to draw lessons from. The U.S. 2017-19 episode, during which the U.S. Federal Reserve reduced its asset holdings by around $750 billion (after a total increase of $3.7 trillion in the previous eight years) at the same time as the European Central Bank and Bank of England ended their QE asset purchase programs. The 2006-07 Japanese experience, during which the Bank of Japan (BOJ) reduced its balance sheet from 155 trillion yen to 100 trillion yen, reversing nearly all the increase over the previous five years.
Limited experience with QT prevents us from being overconfident in using history as a guide to stock market performance during the current QT period. Yet, the previous two periods had similar effects on the stock markets.
- Prior to the Global Financial Crisis of 2008-09, only the BOJ had engaged in QE and so it was alone in unwinding it in 2006-07. In March 2006, the BOJ began a one-year reversal of the entire rise in its balance sheet since QE began in 2001. Over the year that followed March 2006, Japan's Nikkei 225 Index exhibited higher volatility, saw a peak-to-trough decline of 19% and was relatively unchanged for the full 12 months with a rise of just 1.3%.
- The QT by the U.S. Fed took place from October 2017 to September 2019. During that period, stock market volatility increased with a peak-to-trough decline of 19% and the S&P 500® price-to-earnings ratio contraction of 25% peak-to-trough. In fact, 2018 was the worst year for the S&P 500 in a decade, and the worst year that did not include a recession since 1994. From when the Fed's balance sheet began to shrink noticeably in late January 2018 to when it began to rebound in late August 2019, the S&P 500 index was relatively unchanged for the full period, losing -0.2%.
Shrinking Fed balance sheet during last QT in 2017-19
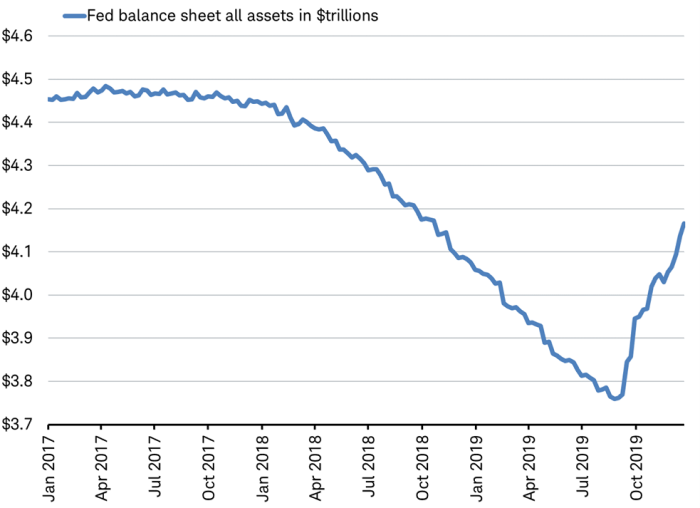
Source: Charles Schwab, Bloomberg data as of 9/23/2023.
This year, the QT-driven shrinking of central bank balance sheets may be increasingly acting as a drag on the overall stock market, although a handful of artificial intelligence-related stocks have been able to pull the stock market higher. If central banks continue QT, it may be increasingly harder for stocks to post gains on such narrow leadership.
Stocks and central bank balance sheets
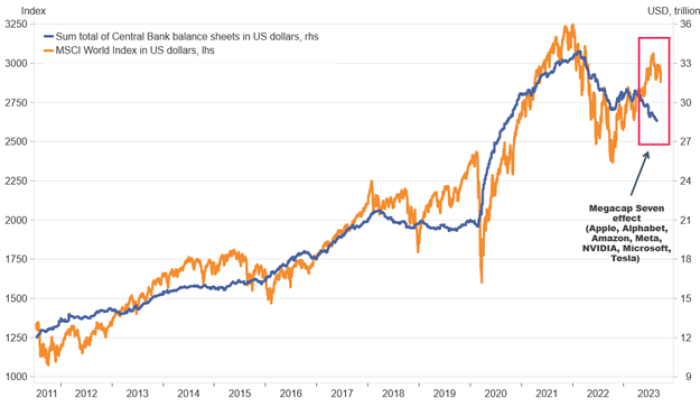
Source: Charles Schwab. Macrobond data as of 9/22/2023.
Central bank balance sheets include: US Federal Reserve, European Central Bank, Bank of England, Bank of Japan, Bank of Canada, Reserve Bank of Australia, Reserve Bank of New Zealand, Riksbank (Sweden's central bank), and Peoples Bank of China. LHS - Left Hand Scale; RHS – Right Hand Scale. Indexes are unmanaged, do not incur management fees, costs, and expenses and cannot be invested in directly. Past performance is no guarantee of future results.
This can be illustrated in the U.S. where the seven megacap tech stocks (Nvidia, Meta, Alphabet, Amazon, Microsoft, Apple, and Tesla) are headquartered. If we exclude these seven megacap tech stocks, the S&P 500 index is flat year-to-date for 2023.
Megacap Seven driving S&P 500
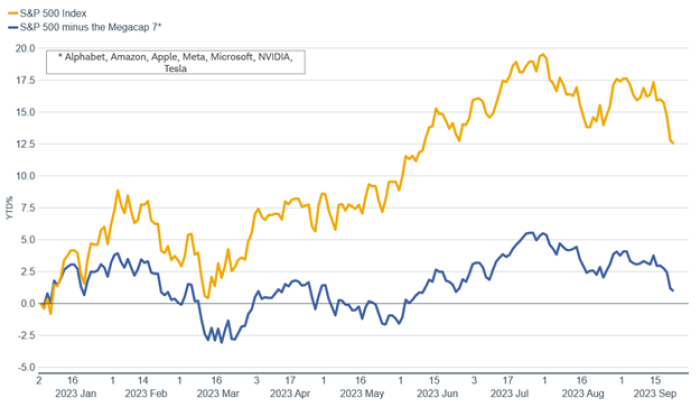
Source: Charles Schwab, Macrobond, S&P Global, MSCI data as of 9/23/2023.
Indexes are unmanaged, do not incur management fees, costs, and expenses and cannot be invested in directly. Past performance is no guarantee of future results.
With the potential to weigh on valuations, increase market volatility, and limit stock market performance, QT may become a bigger focus for investors now that rate hikes may have ended. The CBOE Volatility Index, or VIX, is a real-time market index representing the market's expectations for volatility over the coming 30 days. In mid-September, the VIX index fell to the lowest level since before the pandemic. Additionally, both the MSCI World Index and S&P 500 have not seen a move of more than 2% in either direction for many months. The exceptionally calm stock markets around the world may be ripe for a rise in volatility in the fourth quarter.
Michelle Gibley, CFA®, Director of International Research, and Heather O'Leary, Senior Global Investment Research Analyst, contributed to this report.
Get Schwab's view on international markets.
More from Charles Schwab
Stocks Extend November Gains Ahead of Holiday
Opening Market Update
Closing Market Update
Related topics
The information provided here is for general informational purposes only and should not be considered an individualized recommendation or personalized investment advice. The investment strategies mentioned here may not be suitable for everyone. Each investor needs to review an investment strategy for his or her own particular situation before making any investment decision. All expressions of opinion are subject to change without notice in reaction to shifting market conditions. Data contained herein from third-party providers is obtained from what are considered reliable sources. However, its accuracy, completeness, or reliability cannot be guaranteed. Examples provided are for illustrative purposes only and not intended to be reflective of results you can expect to achieve.
Please note that this content was created as of the specific date indicated and reflects the author's views as of that date. It will be kept solely for historical purposes, and the author's opinions may change, without notice, in reaction to shifting economic, business, and other conditions.
All corporate names and market data shown above are for illustrative purposes only and are not a recommendation, offer to sell, or a solicitation of an offer to buy any security. Supporting documentation for any claims or statistical information is available upon request.
Past performance is no guarantee of future results and the opinions presented cannot be viewed as an indicator of future performance.
Investing involves risk including loss of principal.
International investments involve additional risks, which include differences in financial accounting standards, currency fluctuations, geopolitical risk, foreign taxes and regulations, and the potential for illiquid markets.
Investing in emerging markets may accentuate this risk.
Fixed income securities are subject to increased loss of principal during periods of rising interest rates. Fixed income investments are subject to various other risks including changes in credit quality, market valuations, liquidity, prepayments, early redemption, corporate events, tax ramifications, and other factors.
Performance may be affected by risks associated with non-diversification, including investments in specific countries or sectors. Additional risks may also include, but are not limited to, investments in foreign securities, especially emerging markets, real estate investment trusts (REITs), fixed income, small capitalization securities and commodities. Each individual investor should consider these risks carefully before investing in a particular security or strategy.
The policy analysis provided by the Charles Schwab & Co., Inc., does not constitute and should not be interpreted as an endorsement of any political party.
Indexes are unmanaged, do not incur management fees, costs, and expenses and cannot be invested in directly. For more information on indexes please see schwab.com/indexdefinitions.
0923-3WG5