
When trading options, different statistics can provide insight into what might be happening in the market. With the help of options statistics on the thinkorswim® platform, option traders might be able to make more informed decisions about a particular strategy. Traders can find statistics by navigating to Today's Options Statistics under the Trade tab on thinkorswim.
Today's Options Statistics
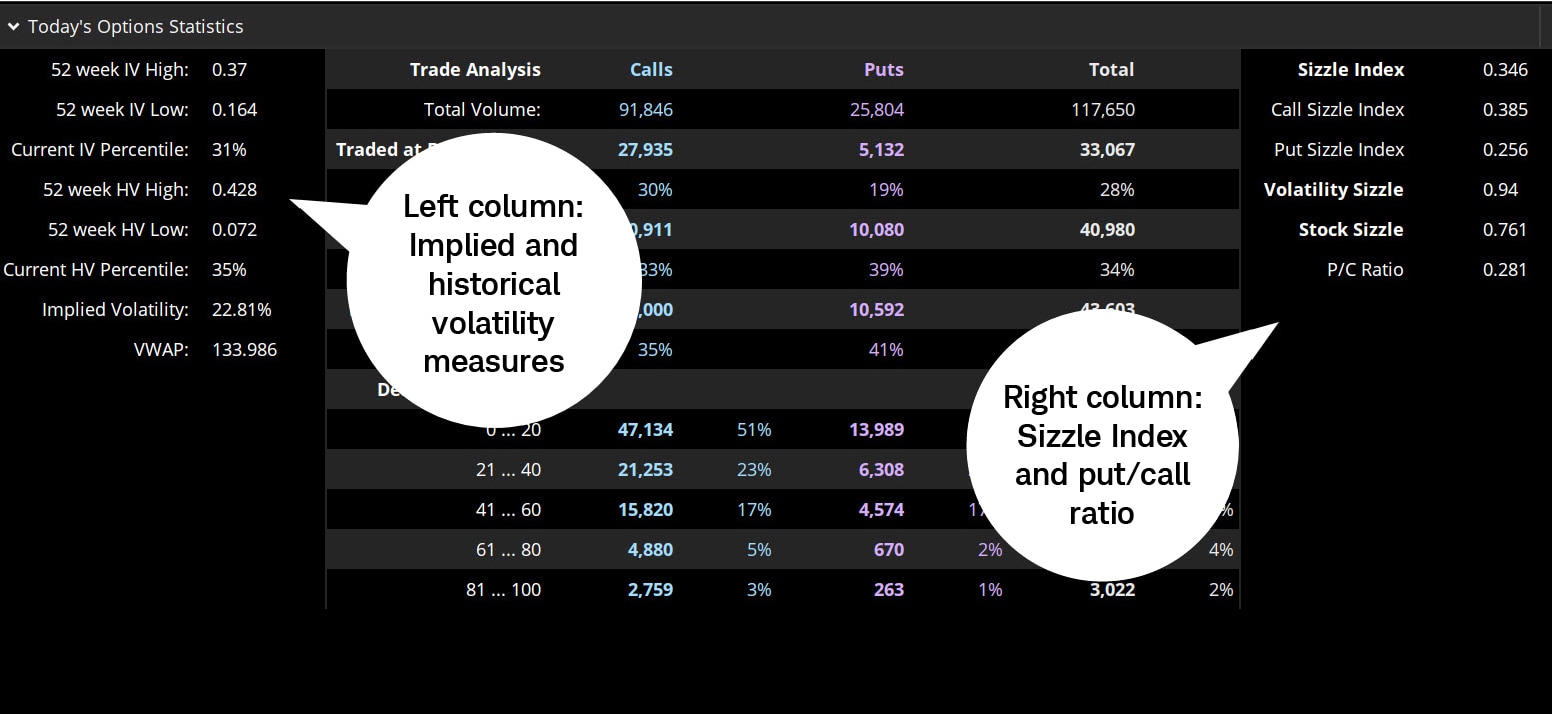
Source: thinkorswim platform
For illustrative purpose only.
Volatility measures
The left column of the options statistics page is devoted to measures of volatility (vol)—both historical volatility1 (HV) and implied volatility (IV)—and how current readings compare to measures over the past year.
IV is the market's forecast of future variability in the underlying stock. It's calculated using a theoretical options pricing model that includes multiple variables including the prices of currently listed options and it's expressed as an annualized level. For example, the stock in the image above shows a current IV reading of 22.81%. This indicates that the options market is essentially pricing in about a 23% variability around the current price as an annualized measurement. Other data on the page adds perspective.
- 52-week IV High/Low. Over the last year, the stock in the above image has seen IV as high as 37% and as low as 16.4%.
- Current IV Percentile. The reading of 31% means the current IV of 22.81 is in the lowest third of all IV readings over the last year. Over the past 52 weeks, 69% of the time, IV was higher than it is now.
IV is relatively low in this stock right now. For more context, a trader might compare IV data to HV.
IV is a theoretical forward-looking measure implied by the options market. HV, by contrast, is backward-looking. It's a moving average of actual price variability in the stock over the previous 52 weeks.
- 52-week HV High/Low. Over the past year, the stock's HV has been as high as 42.8% and as low as 7.2%. It appears to have been volatile at times and relatively static at other times.
- Current HV Percentile. At 35%, the current HV reading is roughly in line with the current IV percentile.
If a trader thinks IV and HV should follow each other up and down, an IV that's lower than HV might suggest IV is understating the stock's potential price change. An IV that's higher than HV might suggest the opposite. Comparing IV and HV might potentially be a useful way to understand how much expected volatility is being priced into options versus how much it actually tends to materialize. In general, higher IV relative to HV potentially suggests options are expensive, while lower IV potentially suggests options are inexpensive. When comparing these statistics, it's important to remember that past performance might not reflect future results.
Some strategies, such as buying single-leg options and vertical spreads2 or calendar spreads3, are often considered more attractive in a low-vol environment. Other strategies, such as covered calls4, cash-secured puts5, and short vertical spreads, might be considered more attractive in a high-vol environment.
The Sizzle Index
The Sizzle Index6 is a measure of what's sometimes considered unusual options activity. The Sizzle Index represents a ratio of a stock's current volume and its average daily volume (ADV) over the last five trading sessions. A Sizzle Index reading greater than 1.0 implies that current volume is greater than it's been over the last five days. A reading below 1.0 implies the opposite. The further the measure is from 1.0, the more it has deviated from its daily average. A sizzle of 4.0 indicates volume four times its average, while a sizzle of 0.5 indicates volume of half its average.
Tracking unusual options volume can offer traders hints as to the strength of a directional move. For example, a spike in the Sizzle Index during a big up or down move in the stock price could potentially indicate strength in the direction. Conversely, a big move on low volume might potentially suggest a lack of conviction in the stock move and might even signal a reversal of the prevailing trend.
It's important to note that there are separate sizzle readings for calls and puts. A look at where the unusual options activity is occurring might hint at market sentiment or where the key price levels might be based on the options trades generating the volume.
Put/call ratio
The put/call (P/C) ratios are often considered among the oldest and most recognizable options statistics. One such ratio is determined by the total put volume divided by the total call volume during the same period. If the volume of calls and puts is the same, the ratio would be 1.0. If twice as many calls traded as puts, it'd be 0.5. If puts had twice the volume of calls, the ratio would be 2.0.
The assumption is that the ratio implies a directional bias. Higher put volume (such as a P/C ratio above 1.0) would imply bearish sentiment, while higher call volume would imply bullish sentiment. However, while this is a relatively common assumption, options volume doesn't always indicate directional bias in the markets.
Like the volatility and sizzle stats, the P/C ratio can be used in conjunction with other indicators to provide more context. Many traders who use technical analysis might use options stats along with moving averages, breakouts, or other chart tools (see image below).
Options stats with technical indicators
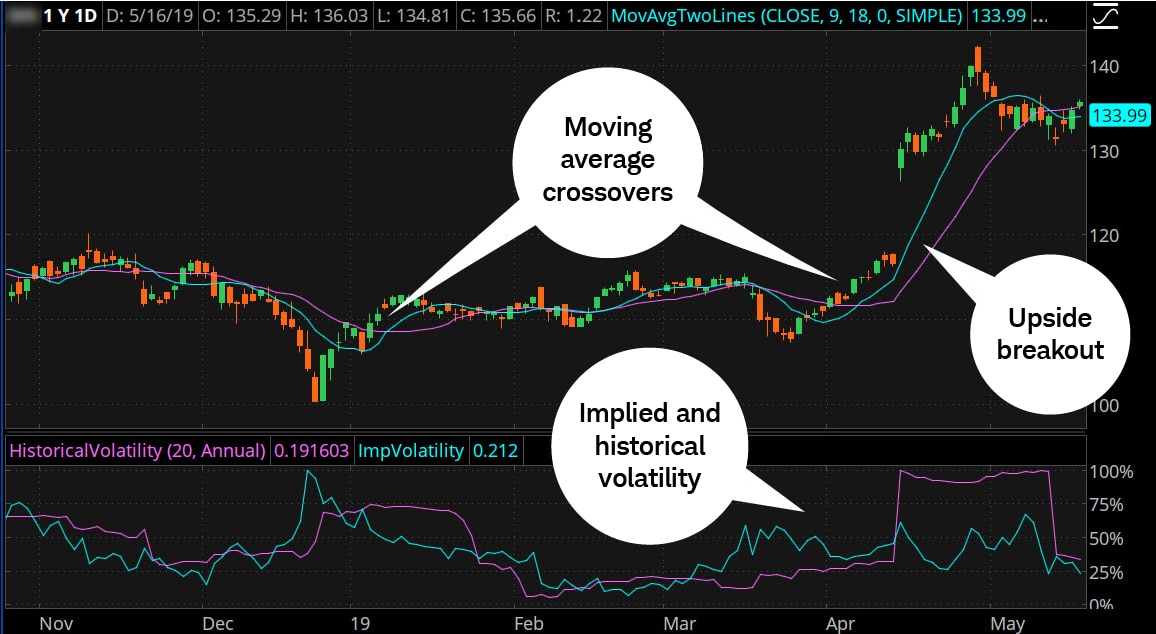
Source: thinkorswim platform
For illustrative purpose only.
Even a longer-term trader who follows fundamental indicators, such as company financials or macroeconomic data, might consider following the options action. Implied and historical volatility, the Sizzle Index, and the put/call ratio can potentially offer signals that traders can use to determine whether a trend may be reversing.
1Also called actual or realized volatility, historical volatility is computed as the annualized standard deviation of prices of a security over a specific period of past trading days, such as 20, 30, or 90 days. Standard deviation is a mathematical measure used to quantify the amount of variation (dispersion) of a set of data values. Historical volatility is based on actual results, whereas implied volatility is an estimate of future price movement.
2An options position composed of either all calls or all puts, with long options and short options at two different strikes. The options are all on the same stock and of the same expiration, with the quantity of long options and the quantity of short options netting to zero. The maximum risk is equal to the combined debit.
3A defined-risk spread strategy, a strategy where the maximum loss is defined at trade entry, constructed by selling a short-term option and buying a longer-term option of the same type (i.e., calls or puts). The goal: As time passes, the shorter-term option typically decays faster than the longer-term option and can be profitable when the spread can be sold for more than you paid for it.
4A limited-return strategy constructed of a long stock and a short call. Ideally, you want the stock to finish at or below the call strike at expiration. If at expiration the stock price settles above the strike price, you'd most likely have your stock called away at the short call strike. Your stock is also subject to being called at any time prior to expiration. You'd keep your original credit from the sale of the call as well as any gain in the stock up to the strike. Breakeven on the trade is the stock price you paid minus the credit from the call and transaction costs.
5A strategy in which an option trader writes, or sells, a put contract to collect a premium but simultaneously deposits in their brokerage account the full cash amount for a potential purchase of underlying shares should they be assigned the short position and obligated to buy at the put's strike price.
6The Sizzle Index is a measure of the current options volume versus the past five trading days' volume. It's a ratio of the current volume of all the options for a stock and the average daily volume for all the options over the past five days. It indicates whether a stock's options are more or less active than they have been. If the Sizzle Index is greater than 1.0, the current options volume is greater than the average of the past five days. If it's less than 1.0, it is lower.
Schwab offers trading tools and platforms.
More from Charles Schwab
Looking to the Futures
Today's Options Market Update
Weekly Trader's Outlook
Related topics
Options carry a high level of risk and are not suitable for all investors. Certain requirements must be met to trade options through Schwab. Please read the options disclosure document titled "Characteristics and Risks of Standardized Options" before considering any option transaction. Call Schwab at 1-800-435-4000 for a current copy. Supporting documentation for any claims or statistical information is available upon request.
With long options, investors may lose 100% of funds invested.
Using protective puts will increase your cost basis in underlying securities.
All stock and option symbols and market data shown are for illustrative purposes only and are not a recommendation, offer to sell, or a solicitation of an offer to buy any security.
Spread trading must be done in a margin account.
Multiple leg options strategies will involve multiple commissions.
Commissions, taxes and transaction costs are not included in this discussion, but can affect final outcome and should be considered. Please contact a tax advisor for the tax implications involved in these strategies.
The information provided here is for general informational purposes only and should not be considered an individualized recommendation or personalized investment advice. The investment strategies mentioned here may not be suitable for everyone. Each investor needs to review an investment strategy for his or her own particular situation before making any investment decision.
Examples provided are for illustrative purposes only and not intended to be reflective of results you can expect to achieve.
0723-3P7B