
Many technical traders like to use stock charts as they make trading decisions. But some common indicators like the Relative Strength Index (RSI) and moving average convergence/divergence (MACD) might not always provide all the information needed.
There are thousands of charting studies and stock chart indicators; the thinkorswim® platform lists more than 300. Three less common studies include the Standard Deviation Channel (SDC), Schaff Trend Cycle (STC), and The Simple Cloud (TSC). Here's how these studies work, and how some advanced traders use them to anticipate the potential for market moves.
Standard Deviation Channel (SDC)
What it is. The SDC is a statistical analysis tool that is normally overlaid on a price chart.
To find it (and others in this article), select the Charts tab on thinkorswim. In the upper right corner, select Analysis Tools > Add Study > All Studies. Then select StandDevChannel from the Studies menu.
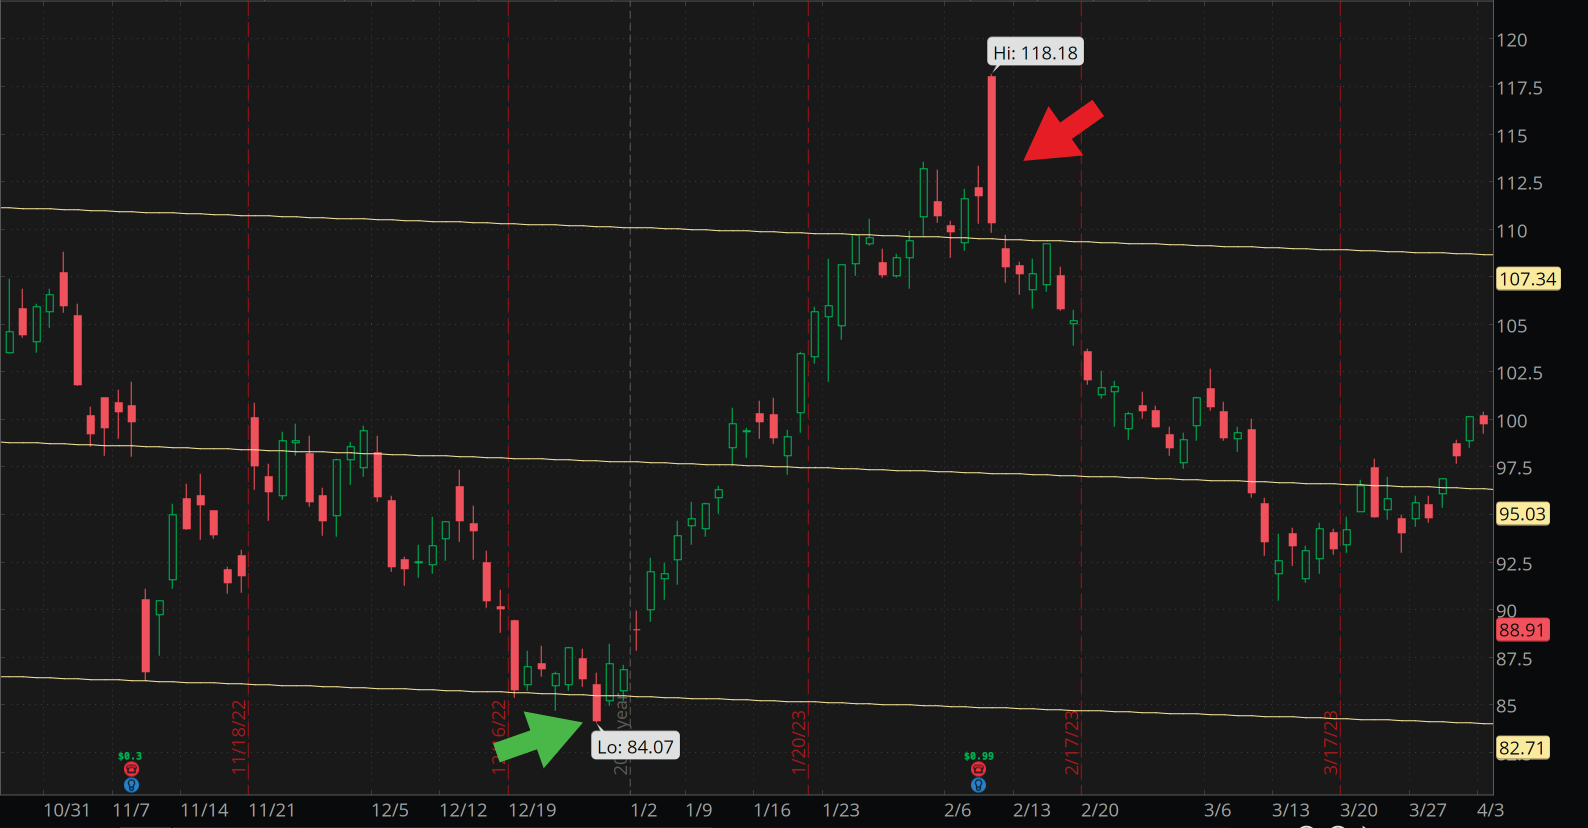
As shown in the image below, the SDC is composed of a middle "regression" trendline that's automatically plotted, as well as two other lines plotted above and below it by one standard deviation (which means it contains 68% of the price data).
Source: thinkorswim platform
For illustrative purposes only. Past performance is no guarantee of future results.
Theoretically, 68% of the price action falls into the SDC if both upper and lower lines are plotted one standard deviation above and below the trendline. If that's increased to two standard deviations, statistically 95% of the price action is expected to fall into the channel.
How it works. The SDC is basically a measure of how much the price has historically tended to move from one point to the next. The study's idea is that prices tend to regress toward that middle line over time, which represents where buyers and sellers have agreed to a price the most number of times. If price moves above the top or below the bottom line, that price is now out of its statistically normal range. The thought is that the price is likely to fall back into that normal range. Another potential explanation is that price is starting a new trend.
When reading the chart above, the yellow line is the regression line. Notice that the price reaches the top line, which is two standard deviations above the middle line, noted with the pink arrow. Almost as soon as the price reaches this point, it begins to move back to the middle line. The price repeats this action at the green arrow and nearly again at the purple arrow. The idea is that because price tends to regress back toward the center line, bullish and bearish potential trade opportunities may present themselves at extreme points of the channel.
Schaff Trend Cycle (STC)
What it is. The STC combines two well-known indicators—the MACD and stochastic. Because these two indicators are typically used together, the STC gives traders the chance to see and learn the benefits of each study while looking at a single output. To find the STC on the thinkorswim platform, select the All Studies drop-down menu and find SchaffTrendCycle in the R-S section.
The theory behind STC is to combine the benefits of trend and cycle indicators and minimize their drawbacks, such as lags or false signals. The STC's main goal is to estimate price direction and potential market turning points.
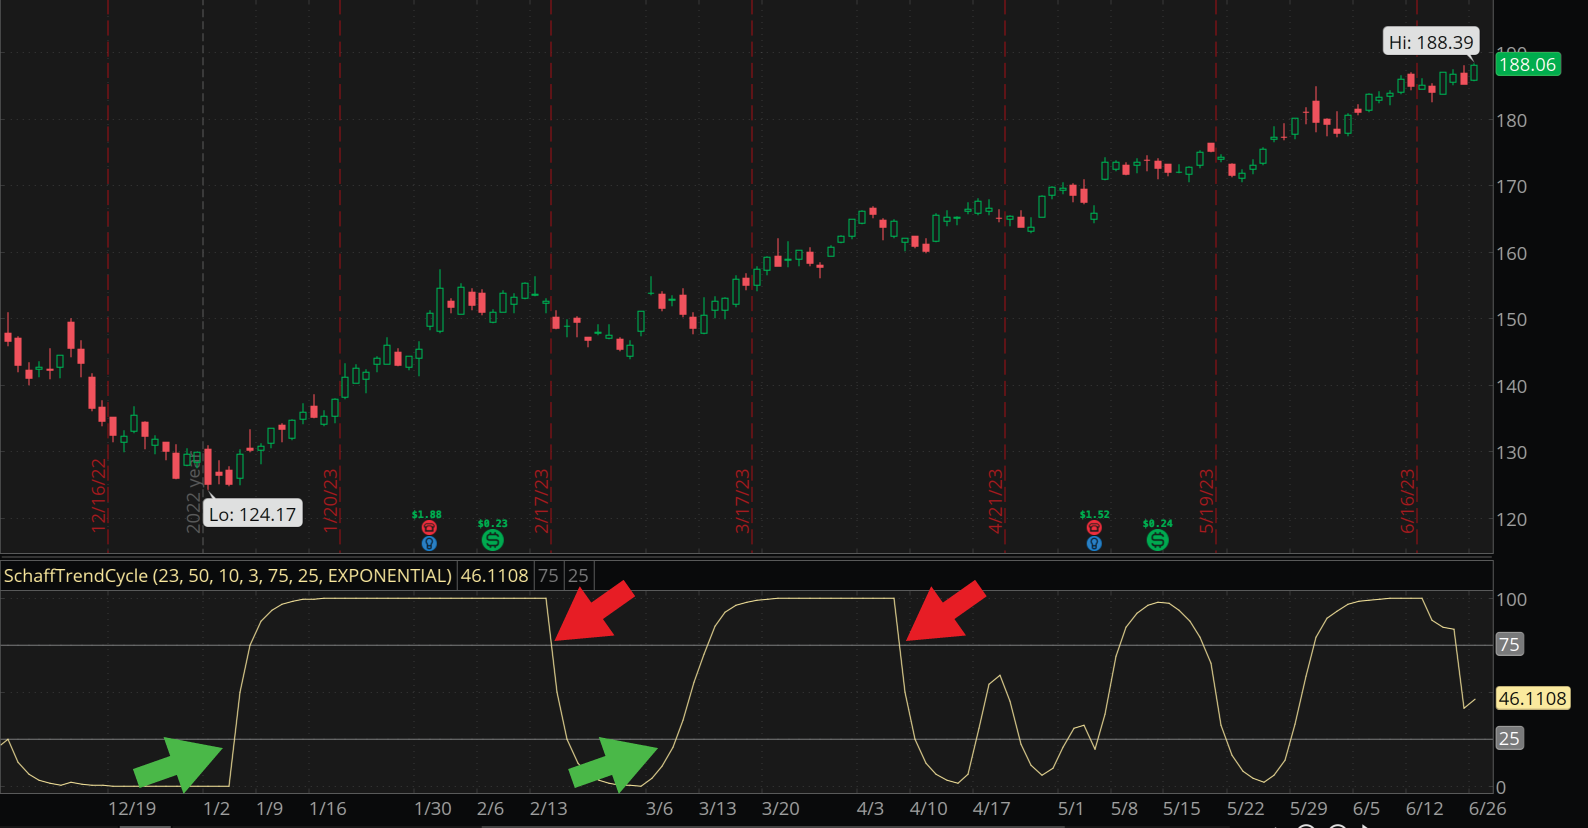
Technically, the STC is an oscillator that moves between 0 and 100 and is calculated as a double-smoothed stochastic of the MACD. In trending markets, the STC is expected to move up if the market uptrend is accelerating. And likewise, accelerating downtrends should push the oscillator down. During sideways markets, the STC attempts to identify potentially oversold conditions when it reverses after falling below 25 or possibly overbought conditions when it turns down from above 75.
How it works. Some chartists use the STC in trending markets to try to determine if the trend is growing or is in a sideways market and might indicate a breakout.
Source: thinkorswim platform
For illustrative purposes only.
Once the indicator reverses and moves above the oversold line at 25, a "buy signal" is triggered, as illustrated by the green arrows on the chart above. Next, after crossing above the top line, which indicates that an asset might be moving into overbought territory, the indicator crosses back below that line, as indicated by the first red arrow. This indicates the trending market has potentially run out of bullish acceleration and might be at a sell point. If the signal lives up to its expectation, a trader might see a downward trend at this point. While this chart might indicate overbought and oversold conditions, an equity can remain in these conditions for quite a while.
The Simple Cloud (TSC)
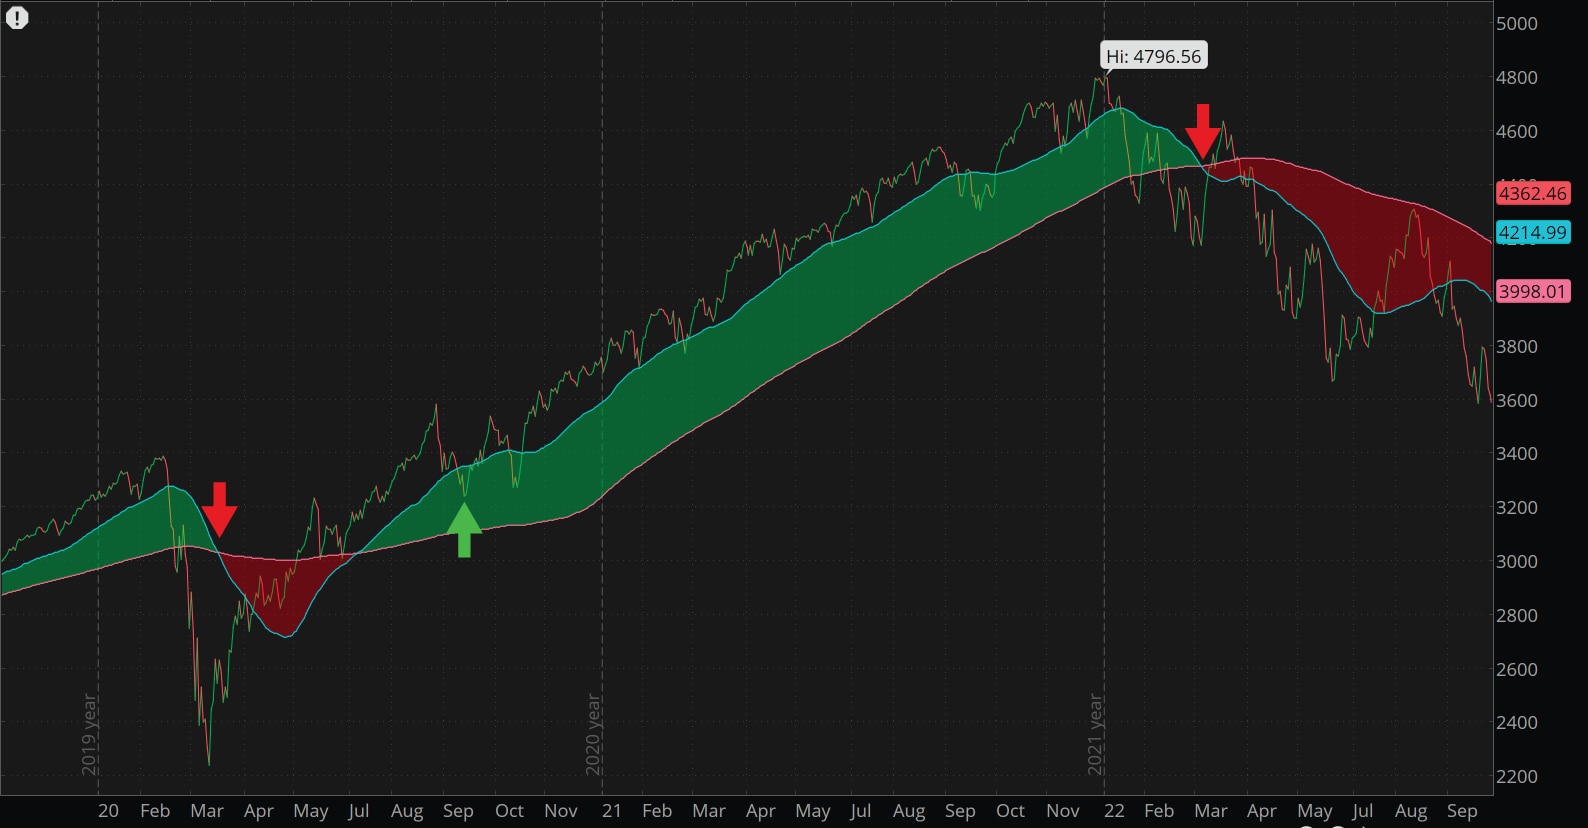
What it is. A relatively unknown indicator, TSC can be overlaid directly on a price chart. As shown in the chart below, TSC uses two separate simple moving averages to define a trend. By default, the indicator uses 20- and 50-day moving averages, with shading between the lines. The color of that shading is used to display trend direction.
Source: thinkorswim platform
For illustrative purposes only.
How it works. TSC recognized the bull trend when price closed inside the green cloud (first green arrow). A confirmed pullback (red arrow) is then observed. If a long position would've been established after the first arrow, this red arrow might indicate that the trend could possibly be over. Then, TSC goes back to work and confirms that a new bullish trend may be beginning with the close price indicated by the second green arrow.
As an aside, when traders can't find what they're looking for with traditional indicators, they can create their own using the thinkScript® tool on thinkorswim. TSC indicator was created by a thinkorswim user through this feature.
Naturally, these studies are simply guides to help determine direction. They are theoretical, offer no guarantee, and can't predict the future. The idea of any chart indicator is to simply help traders identify high-probability chart points to help them take action—i.e., enter, exit, and manage trades. The market changes constantly, so it's worth considering a mix of traditional indicators in your trading arsenal.
Schwab offers trading tools and platforms.
More from Charles Schwab
Looking to the Futures
Today's Options Market Update
The Truth About Corporate Stock Earnings Estimates
Related topics
The information provided here is for general informational purposes only and should not be considered an individualized recommendation or personalized investment advice. The investment strategies mentioned here may not be suitable for everyone. Each investor needs to review an investment strategy for his or her own particular situation before making any investment decision.
All expressions of opinion are subject to change without notice in reaction to shifting market conditions. Data contained herein from third-party providers is obtained from what are considered reliable sources. However, its accuracy, completeness, or reliability cannot be guaranteed.
Examples provided are for illustrative purposes only and not intended to be reflective of results you can expect to achieve.
0723-36YY