
After climbing by more than 100 basis points since late summer, Treasury yields plummeted in the early days of November on signs of slowing economic growth and easing inflation pressures. Ten-year Treasury yields dropped from a high of 5.02% to below 4.50% in less than two weeks' time, before rebounding to the 4.60% area. Two-year Treasury yields also declined sharply, with the market now pricing in the potential for the Federal Reserve to start cutting interest rates as early as June 2024, with a total of 100 basis points (or one percentage point) of cuts being priced in by the end of next year. In the middle of October 2023, only 50 basis points of rate cuts were priced in by the end of next year.
Expectations for rate cuts accelerated after the October employment report
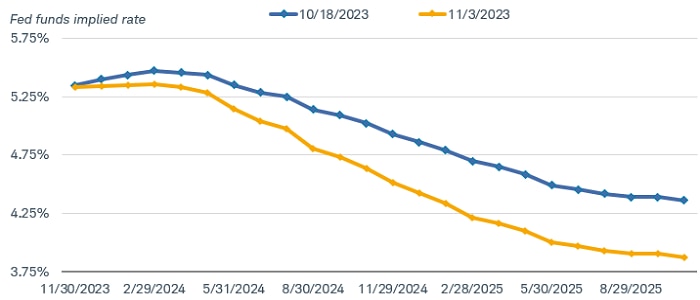
Source: Bloomberg.
Market estimate of the federal funds rate using Fed Funds Futures Implied Rate (FFX3 COMB Comdty). As of 10/18/2023 and 11/3/2023, respectively.
There were several catalysts for the bond market rally. Since the summer, a constellation of factors had combined to send yields to cyclical highs. Strong third-quarter gross domestic product (GDP) growth on the back of resilient consumer spending and employment, rising uncertainty about the potential for an end to the Fed's rate-hiking cycle, and worries about increasing issuance of Treasury bonds combined to create a summer surge in yields. Bond market sentiment was heavily bearish.
However, since late October economic data have shown that the preconditions for the Fed to stop hiking interest rates were emerging. The economy is slowing in response to tightening financial conditions, the labor market is loosening, and inflation is heading lower.
Tightening financial conditions
There are many ways to measure financial conditions, with some relying on market-based indicators such as credit spreads and the direction of the stock market. However, Fed Chair Jerome Powell has noted the rising rates for business loans, mortgages, and consumer loans as evidence that financial conditions have gotten tighter. Based on those criteria, the Fed's policies are having the desired impact.
The pace of business investment has slowed in response to the Fed's rapid rate hikes, which have tightened credit conditions. The percentage of banks tightening credit for businesses of all sizes is at levels seen during recessionary periods in the past.
Banks are tightening their lending standards for commercial & industrial loans
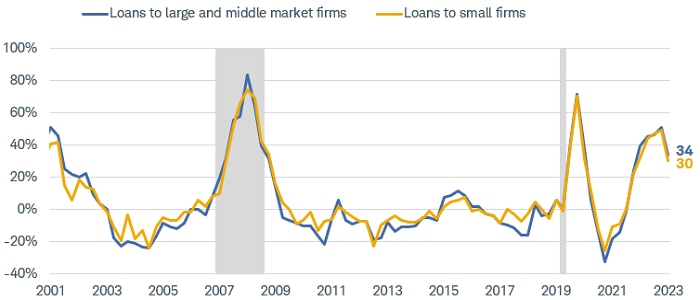
Source: Bloomberg.
Federal Reserve's Senior Loan Officer Survey: Net Percent of Domestic Respondents Tightening Standards for Commercial & Industrial Loans for Large/Medium Sized Firms and Small Firms, and the NBER's U.S. Recession Index (SLDETIGT Index, SLDETIGTS Index, and USRINDEX Index). Shaded areas indicate past recessions. Quarterly data as of 10/31/2023.
With the cost of capital rising, business surveys have been weak. While the manufacturing sector has been weak for quite a while, recently service sector indicators have begun to show softer trends in overall activity, plans for hiring, and prices paid. Although new orders rose in October, they've generally been trending lower since peaking in 2021, and are well below the pre-pandemic levels.
ISM services is showing some softening
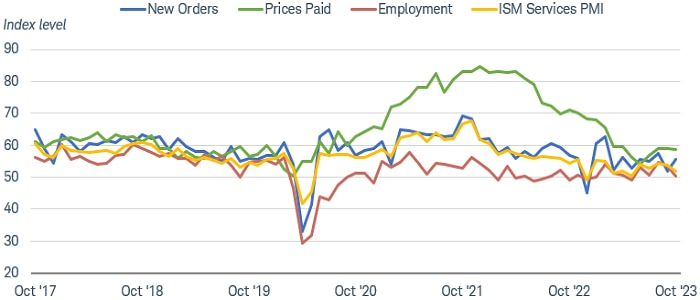
Source: Bloomberg, Institute for Supply Management.
ISM Services PMI (NAPMNMI Index), ISM Services PMI Business New Orders (NAPMNNO Index), ISM Services PMI Business Prices (NAPMNPRC Index), ISM Services PMI Business Employment (NAPMNEMP Index). Monthly data as of 10/31/2023.
In addition, the labor market is showing signs of loosening after the surge in hiring and wages after the pandemic. The unemployment rate has risen from a low of 3.4% in January to 3.9%, the pace of job growth has fallen by half in the past year, and wage growth has slowed to a year-over-year pace of 4.1%—the lowest reading since June 2021. These are discouraging readings for job seekers but suggest that supply and demand in the labor market is coming back into balance.
Inflation is declining
For the Federal Reserve, the most important indicator is inflation. The news there has been encouraging, as well. The metric that the Fed uses as its benchmark—the deflator for personal consumption expenditures less food and energy (core PCE) has slowed to a 3.7% year/year pace. That is still far from the Fed's 2% target, but it is consistent with its forecast for year-end inflation in 2023. Moreover, it has been decelerating, with month-to-month readings declining most of this year. On an annualized, three-month-change basis, core PCE rose by just 2.5% in September.
Inflation is nearing the Fed's 2% target
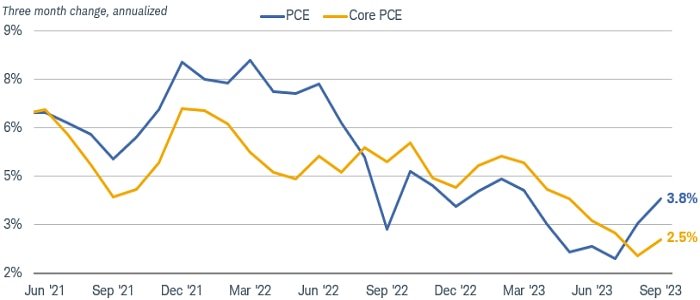
Source: Bloomberg, using monthly data as of 9/30/2023.
US Personal Consumption Expenditures Chain Type Price Index SA (PCE DEF Index) and US Personal Consumption Expenditure Core Price Index MoM SA (PCE CORE Index). Personal Consumption Expenditures (PCE) includes a measure of consumer spending on goods and services among households in the U.S. The PCE is used as a mechanism to gauge how much earned income of households is being spent on current consumption for various goods and services. Core PCE excludes food and energy prices, which tend to be volatile.
As for the worries over Treasury issuance, we believe the concerns were overblown. As deficits grow, there will be increased supply of Treasuries for the market to absorb. However, the Treasury is pacing out its issuance of long-term bonds to avoid overwhelming the market. More importantly, it appears that yields in the vicinity of 5% were high enough to attract buyers. Domestic buyers—households and mutual funds—have shown significant increases in purchases of Treasuries in the past year as yields pushed higher. Over the long run, supply is a less significant factor for the direction of yields than Fed policy and inflation.
Not as high for not as long?
Given the progress made toward its goals, we agree with the market view that the Fed is unlikely to hike the federal funds rate again in this cycle. The market may be a bit too optimistic about the timing and pace of rate cuts in 2024, but we would not rule out some easing by mid-year if current trends continue. It's worth noting that the Fed still plans to reduce its balance sheet by allowing the bonds it holds to mature—a form of tightening. Consequently, monetary policy will still be exerting a negative influence on the economy into the future, likely keeping inflation in check.
Over the next few months, the Treasury market is likely to remain volatile as markets assess the economic trends and implications for Fed policy. Our take is that the peak in yields for the cycle has been reached and the market action is consistent with our view that fair value for 10-year Treasuries is in the 4.0% to 4.25% region.
We continue to suggest investors gradually extend the duration of their bond portfolios to match their investing time horizon. The benchmark we use, the Bloomberg US Aggregate Bond Index, has an average duration of about 6.2 years, which we view as a reasonable target. Given the slowing in the economy, we suggest staying in higher-credit-quality bonds—such as Treasuries and investment-grade corporate and municipal bonds—for the majority of their fixed income holdings.
Find bonds that are right for you.
More from Charles Schwab
4 of Investors' Biggest Concerns Now
This Week's CPI Data and the State of the Economy
Schwab Market Perspective: Upside-Down
Related topics
The information provided here is for general informational purposes only and should not be considered an individualized recommendation or personalized investment advice. The investment strategies mentioned here may not be suitable for everyone. Each investor needs to review an investment strategy for his or her own particular situation before making any investment decision. All expressions of opinion are subject to change without notice in reaction to shifting market conditions. Data contained herein from third-party providers is obtained from what are considered reliable sources. However, its accuracy, completeness, or reliability cannot be guaranteed. Examples provided are for illustrative purposes only and not intended to be reflective of results you can expect to achieve.
Past performance is no guarantee of future results.
Investing involves risk, including loss of principal.
Fixed income securities are subject to increased loss of principal during periods of rising interest rates. Fixed income investments are subject to various other risks including changes in credit quality, market valuations, liquidity, prepayments, early redemption, corporate events, tax ramifications, and other factors.
Lower rated securities are subject to greater credit risk, default risk, and liquidity risk.
The policy analysis provided by the Charles Schwab & Co., Inc., does not constitute and should not be interpreted as an endorsement of any political party.
Forecasts contained herein are for illustrative purposes only, may be based upon proprietary research and are developed through analysis of historical public data.
Futures and futures options trading involves substantial risk and is not suitable for all investors. Please read the Risk Disclosure Statement for Futures and Options prior to trading futures products.
Tax-exempt bonds are not necessarily a suitable investment for all persons. Information related to a security's tax-exempt status (federal and in-state) is obtained from third parties, and Charles Schwab & Co., Inc. does not guarantee its accuracy. Tax-exempt income may be subject to the Alternative Minimum Tax (AMT). Capital appreciation from bond funds and discounted bonds may be subject to state or local taxes. Capital gains are not exempt from federal income tax.
The information and content provided herein is general in nature and is for informational purposes only. It is not intended, and should not be construed, as a specific recommendation, individualized tax, legal, or investment advice. Tax laws are subject to change, either prospectively or retroactively. Where specific advice is necessary or appropriate, individuals should contact their own professional tax and investment advisors or other professionals (CPA, Financial Planner, Investment Manager) to help answer questions about specific situations or needs prior to taking any action based upon this information.
Supporting documentation for any claims or statistical information is available upon request.
Indexes are unmanaged, do not incur management fees, costs, and expenses and cannot be invested in directly. For more information on indexes please see schwab.com/indexdefinitions.
The Schwab Center for Financial Research is a division of Charles Schwab & Co., Inc.
Source: Bloomberg Index Services Limited. BLOOMBERG® is a trademark and service mark of Bloomberg Finance L.P. and its affiliates (collectively "Bloomberg"). Bloomberg or Bloomberg's licensors own all proprietary rights in the Bloomberg Indices. Neither Bloomberg nor Bloomberg's licensors approves or endorses this material, or guarantees the accuracy or completeness of any information herein, or makes any warranty, express or implied, as to the results to be obtained therefrom and, to the maximum extent allowed by law, neither shall have any liability or responsibility for injury or damages arising in connection therewith.
1123-3WJS