
When it comes to analyzing stocks, there are two primary studies: fundamental analysis and technical analysis. Fundamental analysis can help traders decide what to own, and technical analysis may help traders know when to buy or sell. Fundamental analysis and technical analysis strategies both have loyal followings among traders, but in this article, we're only focusing on fundamental analysis.
What is fundamental analysis?
Fundamental analysis of stocks involves evaluating and researching companies to determine if a company is healthy. Remember this, there's no one right way to go about analyzing companies. Consider the successes of two well-known investors and their different approaches: Warren Buffett and Peter Lynch. Buffett looks for great companies that trade at a fair price, also known as value investing. Lynch, on the other hand, believes in researching companies whose products many, including himself, already enjoy. These styles reinforce how trading techniques come down to personal objectives or what you want to achieve.
How do you become your own analyst? The Company Profile tool on the thinkorswim® platform opens the door to the world of fundamental investment analysis that might help you focus on fundamental data that matters to you. That could mean price-to-earnings ratios, company earnings, or key economic indicators, such as housing, jobs, and interest rates.
Fundamental stock analysis, trader style
Investors who base their decisions on fundamental analysis tend to approach the markets in two ways: top down and bottom up. The approach you use often depends on your goals. So, start by answering what it is you're looking for in a trade.
If you prefer a top-down approach, you might begin researching global economics, make your way to sector analysis, then to industry analysis, and finally narrow it down to a couple of stocks. A bottom-up approach starts with the list of stocks and then opens up to a broader analysis of each stock.
Stock analysts are known for building complex equity models to help them adjust a company's valuation based on pulling certain "levers." For instance, suppose sales of widget X are up 10%, advertising pricing is decreasing by 1%, and operating margins are increasing by 2%. The Company Profile tool lets you automatically adjust these levers to make your own projections. You may want to know if there's anything about the company (or companies) you're about to trade that could potentially help your analysis.
Let's look at an example of how you might use the tool.
Imagine it's the start of the new year. You promise to hit the gym, and with that, you figure millions of wishful thinkers will not only be going for six-pack abs, they'll also be shopping for new workout clothes. So, you look for a company that specializes in "performance apparel."
You've narrowed your selection to two companies. Both have diversified businesses, so you're looking for one where there's a higher concentration of revenue in performance apparel. In addition, you're looking for the brand that's squeezing out higher margins in its apparel business. Finally, you're looking for the company that's trading at a discount relative to its valuation. In about 45 seconds, you should be able to zero in on what you think looks like the better opportunity. How?
On the thinkorswim platform, select the Trade tab and enter a stock symbol. Then select Company Profile at the top right to bring up the tool. Select a business division in the left bar (see below). Next, select a forecast measure in the right column to view the data or slide the levers to see what your forecasts may reveal.
The Company Profile tool
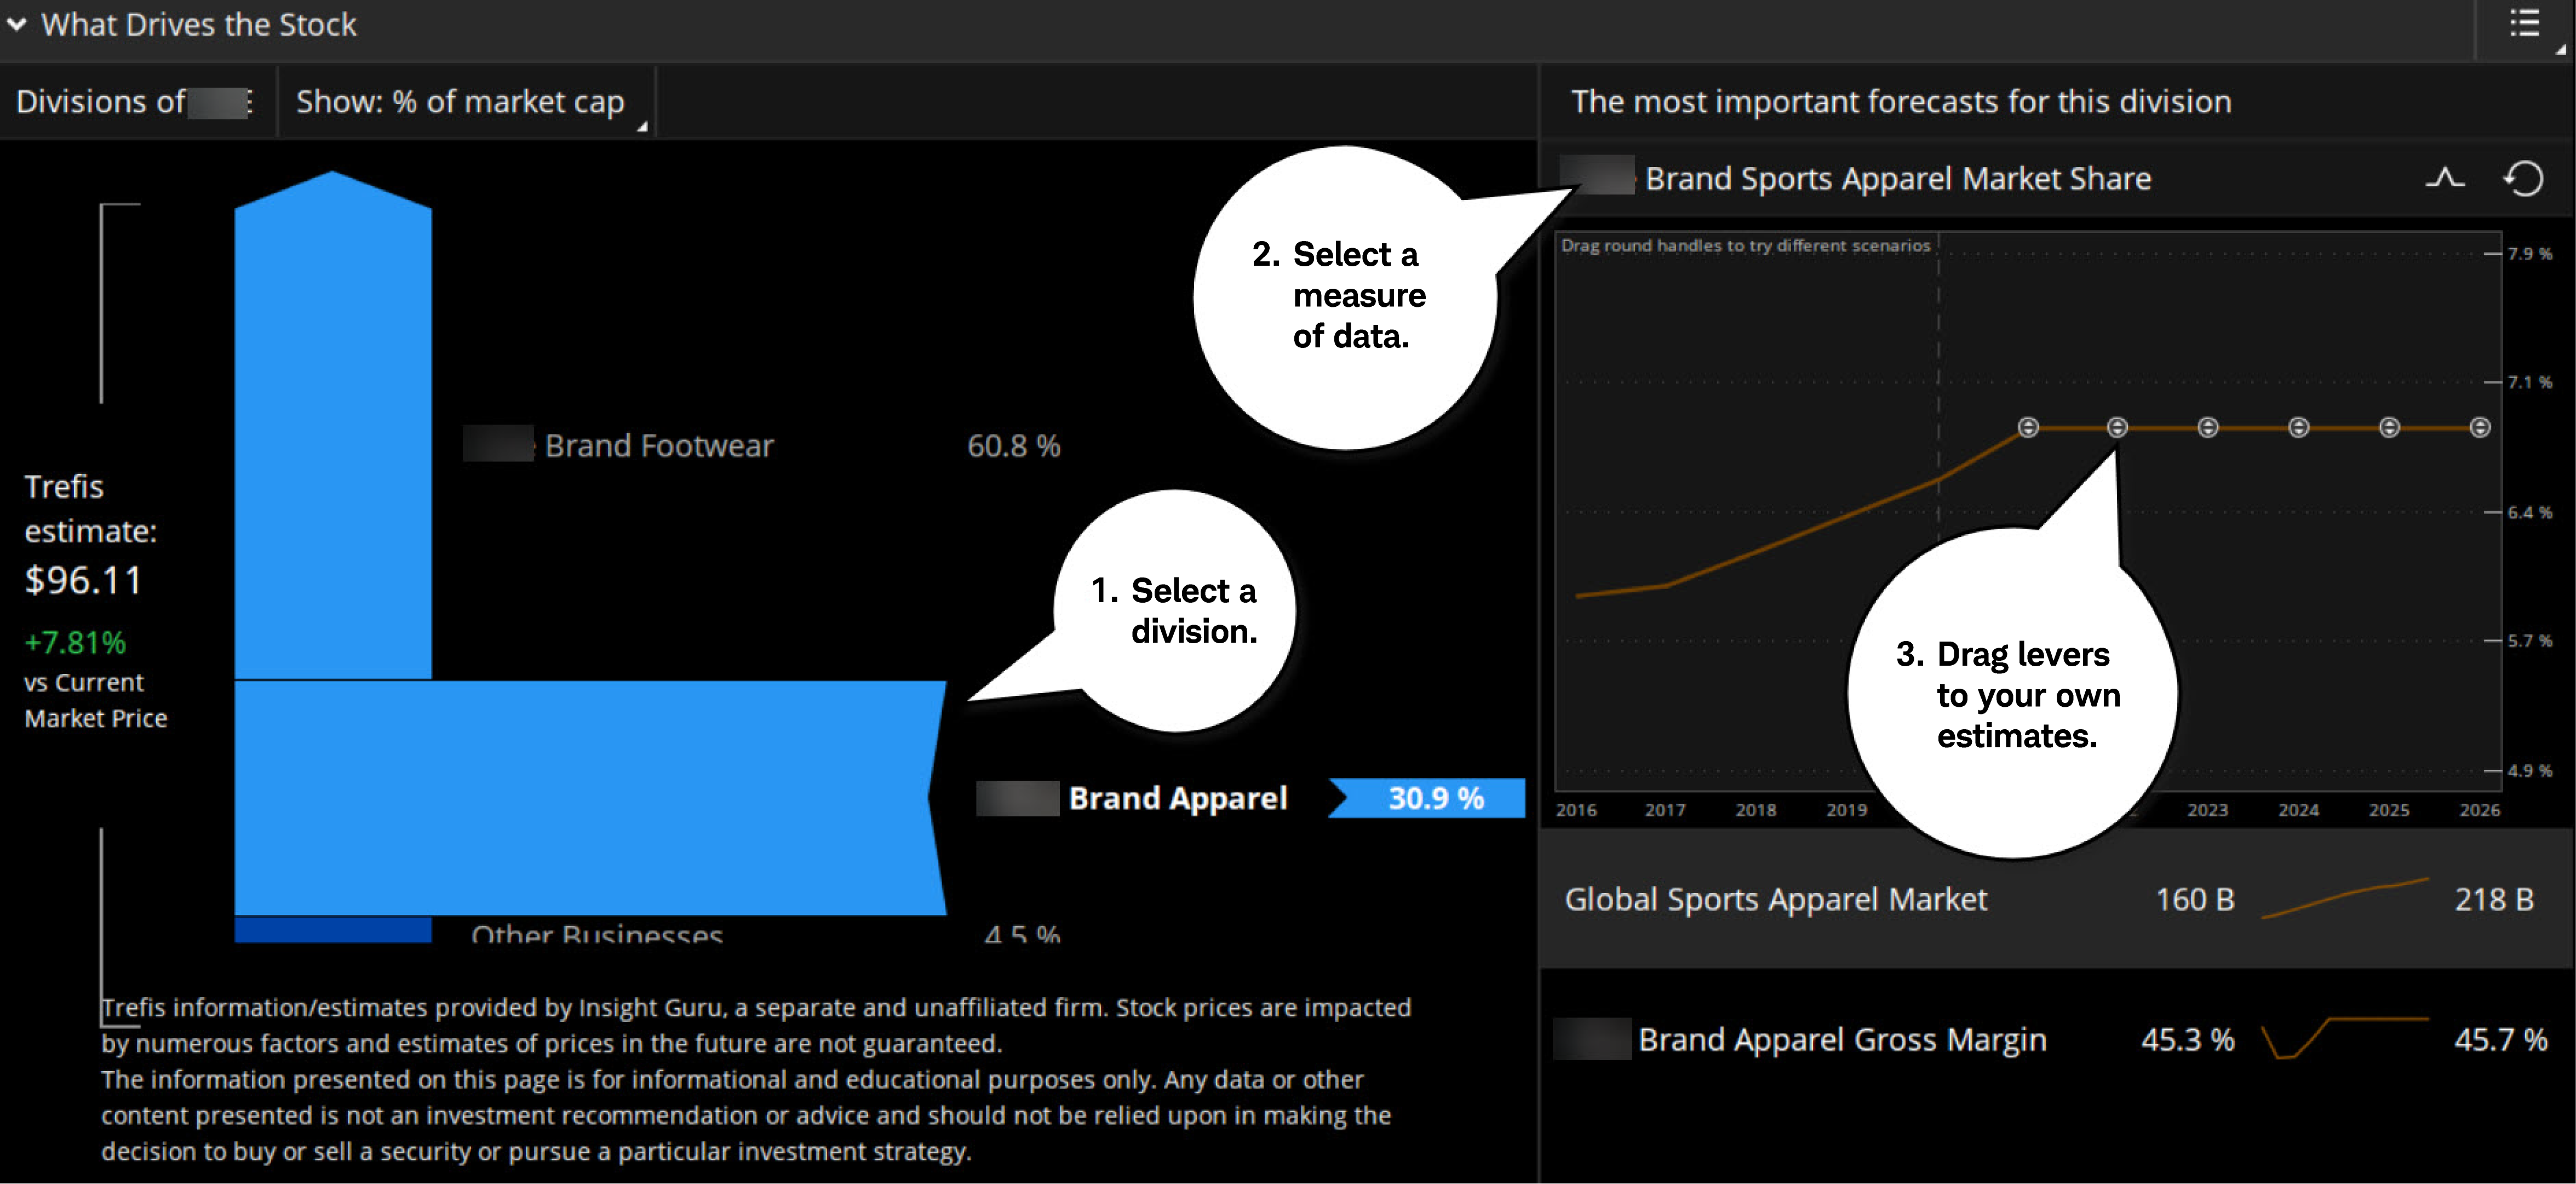
Source: thinkorswim® platform
For illustrative purposes only. The company profile is not available for every symbol. Past performance does not guarantee future results.
Pulling the levers:
1. On the blue vertical bar at the left of the tool window, select the division of the business you'd like to analyze.
2. In the right column of The most important forecasts for this division, choose a topic, such as revenue or gross profit margin.
3. Drag estimates of these forecasts (the "levers") based on your own findings. Suppose you believe that with increased demand for performance apparel, there'll be a near-term sales spike resulting in a greater market share. By moving that lever up slightly, you can see the impact it'd have on the valuation estimate.
By studying the business divisions within a company, you may get more insight into its direction.
Finding divergence: When there's a difference between your projections (as adjusted by the levers), analyst estimates (select Analyze > Fundamentals > Overview), and the current market price, you've found what's called divergence. And divergence is where you can often discover some helpful directional-trading potential—both to the upside and downside.
Does it really matter?
There are still plenty of ways fundamentals—along with the Company Profile tool—can help influence your trading decisions.
- Do your homework
Suppose you discover an exciting new product. You research the company, and everything checks out. The technicals seem to indicate the time is right for entry, so you pull the trigger only to learn the product you adore adds 3% to the company's bottom line.
In this scenario, the Company Profile tool can help you validate or disprove your assumptions. It can also help you understand how much revenue is attributable to the bottom line from the company's combined revenue drivers.
- Pairs trades
When two companies trend in lockstep, they're said to be correlated. Correlated stocks are typically among a pair of stocks in the same sector. When one stock diverges in price from the other and correlation breaks up, there might be an opportunity for a pairs trade by buying one stock and shorting the other, with the hope the stocks will again converge and resume their normal correlation.
In this case, to help assess correlation, use the Company Profile tool to validate the pair itself. In other words, a chart may show that a pairs trade looks great, but the tool could help you understand if there's too much risk in one business over the other. For example, you may have two giant energy companies that appear to be in the same business, but maybe you favor one over the other for technical reasons. By digging deeper into their business divisions, you might find one has a high amount of natural gas drilling that could either threaten the correlation or simply tell you it's not a great pairs trade to start with.
Equity pairs trading is not suitable for all investors and requires active monitoring and management as the special risks inherent may expose investors to potentially unlimited losses.
- Finding soldiers
In longer-term position trades, the tool compares "generals to soldiers." First-tier companies (generals) that serve as sector proxies tend to have lower volatility and might not offer the ideal opportunity.
However, if you're anxious to be in this sector, you might look for second- and third-tier companies (soldiers) that have room to grow. Do they have similar business units to the generals and a similar makeup of those units? Are the growth projections of those units what you'd expect? The tool might help you answer these questions.
No textbook required
Remember in high school when Cliffs Notes were your BFF? With so much great technology in the trading world these days, the thought of fundamental analysis no longer has to provoke anxiety attacks and extreme dread.
Think of the Company Profile tool as a handy guide that might offer some quick analysis findings. You can potentially save yourself countless hours wading through beefy analyst reports and speedily get the insights needed to trade companies with products and services you're interested in.
Schwab offers trading tools and platforms.
More from Charles Schwab
Looking to the Futures
Today's Options Market Update
Weekly Trader's Outlook
Related topics
The information provided here is for general informational purposes only and should not be considered an individualized recommendation or personalized investment advice. The investment strategies mentioned here may not be suitable for everyone. Each investor needs to review an investment strategy for his or her own particular situation before making any investment decision.
All expressions of opinion are subject to change without notice in reaction to shifting market conditions. Data contained herein from third-party providers is obtained from what are considered reliable sources. However, its accuracy, completeness, or reliability cannot be guaranteed.
Examples provided are for illustrative purposes only and not intended to be reflective of results you can expect to achieve.
0423-3X0S