
The 10-year Treasury yield briefly touched 5% last month. Rather than celebrating the opportunity to invest in bonds at the highest levels since 2007, we find that many investors are facing this situation with nervousness and trepidation.
Bond prices have fallen sharply over the last two years. (Bond prices and yields move in opposite directions.) The Bloomberg US Aggregate Bond Index is down more than 2% this year and is on pace for its third straight annual loss.1 Last year's 13% loss was the largest on record, which likely caught a lot of investors off guard.
The Bloomberg US Aggregate Bond Index is on pace for its third straight annual loss
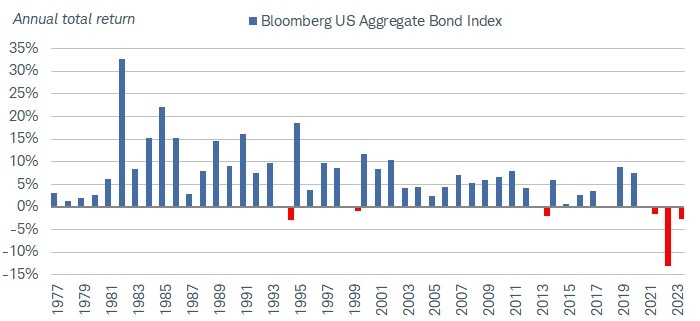
Source: Bloomberg, as of 10/30/2023.
Bloomberg US Aggregate Bond Index (LBUSTRUU Index). Total return includes reinvestment of interest and price gains or losses. Indexes are unmanaged, do not incur management fees, costs and expenses, and cannot be invested in directly. Past performance is no guarantee of future results. 2023 returns are as of 10/30/2023.
For investors who may be nervous, it's important to remember one of the key reasons you hold bonds: the income payments they provide. And while it may seem tempting to wait for yields to rise even further, we never suggest investors try to time the market and wait for the "perfect" time to invest. More importantly, we believe it's likely that interest rates are at or near the peak for this cycle. We continue to suggest investors consider adding some intermediate- and long-term bonds to lock in these high yields with certainty.
Here are some answers to the most common questions we've received:
1. My bond holdings are down in value—should I be concerned?
Declining bond values may be concerning for many investors, but those losses are temporary if the bonds are held to maturity. It's difficult to ignore the price declines when you log into your account or you open your monthly statement, but those prices are indicative of what other investors would be willing to pay for your bonds today. If you are planning to hold to maturity and aren't looking to sell your bonds now, you can look through those price declines and expect to be repaid the principal at par at maturity. That idea that bonds mature at a stated par value can provide light at the end of the tunnel.
While most bond values are down, don't forget the income that they provide. Over time, a bond's total return is driven more by income payments than by price gains or losses.
For example, consider a five-year Treasury note that was issued at the end of 2021, before the Federal Reserve began aggressively hiking rates, with a coupon rate of 1.25%.2 Today, its price in the secondary market is roughly $890 (compared to its $1,000 par value), meaning it's down more than 10%. That bond now has a little more than three years to maturity, since nearly two years have passed since it was issued. It will continue to make those scheduled coupon payments of 1.25% per year. That 10% price decline might seem daunting, but it will mature at par and investors will have earned 1.25% annually by holding that bond.
It's true that there is an opportunity cost for holding lower-yielding bonds when interest rates rise, but it's not necessarily a loss of value if held to maturity.
2. What about my bond funds? Their values are down, and they don't mature.
For bond funds, it's not as straightforward, because they generally don't have defined maturity dates or predictable values at maturity.
There's not necessarily a "light at the end of the tunnel" like there is with individual bonds, but the decline in a fund's value should be accompanied by a rise in income payments over time. Even for passive funds that are meant to simply track an index, the portfolio managers rebalance the holdings as time passes. As they sell some holdings (likely at a loss), they'll generally be reinvesting in new bonds with higher yields. That means higher income payments for bond fund investors—a benefit that individual bondholders don't usually get since most coupon payments are fixed.
When considering bond funds, it's always important to match your investing horizon with the average maturities of the fund's underlying bond holdings.
Whether it's an individual bond or bond fund, we suggest investors consider the income payments earned to calculate the actual performance. It might be tempting to just look at a gain or loss when evaluating the holdings online, but it only tells part of the story.
Looking at losses can be concerning, but they may also provide an opportunity to tax-loss harvest. The drop in the bond market can help offset some gains elsewhere.
3. Since yields have been rising, why shouldn't I just wait for them to rise even more before I consider buying bonds?
We're often asked some variation of this question: "Is the 10-year Treasury note now a buy?"
We do think the yield that the 10-year Treasury note offers is attractive, but it doesn't need to a be a binary decision. It shouldn't be a decision between cash and longer-term bonds—it should be somewhere in between, with a blend of maturities.
Investors staying in cash or very short-term investments at the expense of a more diversified portfolio of bonds are implicitly trying to time the market, and that's challenging for anyone. Unless you need access to all of that cash in the near term, it doesn't make sense to hold a large portion of your bond investments in securities with very short-term maturities.
Staying too short could mean reinvestment risk down the road. Reinvestment risk is the risk that investors will accept lower yields once the Federal Open Market Committee (FOMC) does begin to cut its benchmark federal funds rate (the rate at which banks lend to each other overnight). Rate cuts don't appear likely in the near term, but market expectations suggest that rate cuts could come sometime in the middle of next year.
In past cycles, the 10-year Treasury yield has peaked before the federal funds rate hit its peak, only to decline in the months that followed. We won't know when that peak was hit until after the fact, but we think we're at or near the peak now. By waiting too long to consider adding some intermediate- or long-term bonds to your portfolio, you may end up with lower yields than what could be available today.
Treasury yields tend to peak before the Fed hits its peak
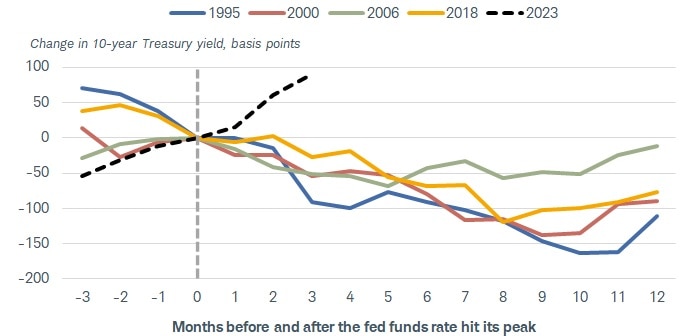
Source: Schwab Center for Financial Research with data from Bloomberg, as of 10/31/2023.
US Generic Govt 10 Yr (USGG10YR Index) and Federal Funds Target Rate - Upper Bound (FDTR Index). Change in 10-year Treasury yield using monthly data, with the peak fed funds rate at month zero using the following months: February 1995, May 2000, June 2006, and December 2018. Dotted black line represents the current cycle, as of 10/31/2023, assuming that the July 2023 rate hike was the last of this cycle. A basis point is 1/100th of a percentage point. Past performance is no guarantee of future results. For illustrative purposes only.
That's one reason we have emphasized that we like laddered strategies or barbells, as they allow investors to average into positions over time. Rising bond yields can actually be good for those in ladders because they are able to reinvest at higher yields over time and generate more income.
4. If the Fed is near its peak, why have yields risen so much lately?
There are a number of reasons why yields have risen lately. One reason is likely the "higher for longer" theme related to Fed policy. Long-term yields are generally based on expectations for the future path of short-term interest rates. With the Fed likely to hold rates elevated for longer than expected, it's natural for long-term rates to drift a bit higher.
According to projections from Federal Reserve officials, the median projected federal funds rate for the end of 2024 is now 100 basis points (or one percentage point) higher than the median implied at the final FOMC meeting of 2022, as the chart below illustrates.
The solid blue line is the 10-year Treasury yield, and the dotted lines are the year-end federal fund rate projections for each year shown. For example, the green dotted line is the year-end 2024 federal funds rate projection. That projection was only introduced at the September 2021 FOMC meeting, at which the median projection from Fed officials suggested a year-end 2024 rate of just 1.8%. At the September 2023 meeting, the median projection suggested a year-end 2024 rate above 5%.
The 10-year Treasury yield has moved up along with those estimates. The uncertainty about the terminal rate led investors to demand more risk premium.
The median projections for year-end federal funds rates have risen
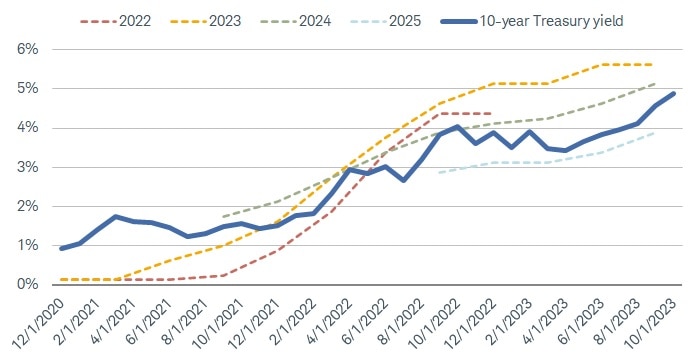
Source: Schwab Center for Financial Research with data from Bloomberg.
US Generic Govt 10 Yr (USGG10YR Index) and Federal Funds Target Rate - Upper Bound (FDTR Index). Lines represent the change in the federal funds target rate for each year based on the FOMC meeting dates of 12/26/2020 through 9/20/2023. Past performance is no guarantee of future results. For illustrative purposes only.
The "higher for longer" theme stems from the resilience of the economy. The economy has held up better than expected in the face of such an aggressive pace of rate hikes, likely driven by strong household and corporate balance sheets as a result of the pandemic-driven stimulus. Monetary policy acts with long and variable lags, and this cycle has seen the economy hold up better than expected based on what historical relationships suggested. The transmission of policy tightening has been slow to translate into slowing growth.
It could also be driven by higher global bond yields, like Japanese government bond yields. After hovering near zero or below for years, the 10-year Japanese government bond yield inched up to the 0.25% area in 2022 as the Bank of Japan hinted at changes to its yield curve control program. Then recently, yields rose even higher—doubling from the 0.4% area in early July to over 0.9% on October 31—as the central bank changed the 1% yield level to a reference rate rather than a cap.
While a rise from 0.4% to 0.9% might seem small, it represents a large shift given how accommodative monetary policy has been in Japan over the years and could be a driver behind the recent rise in U.S. yields.
Japanese government bond yields have doubled since July
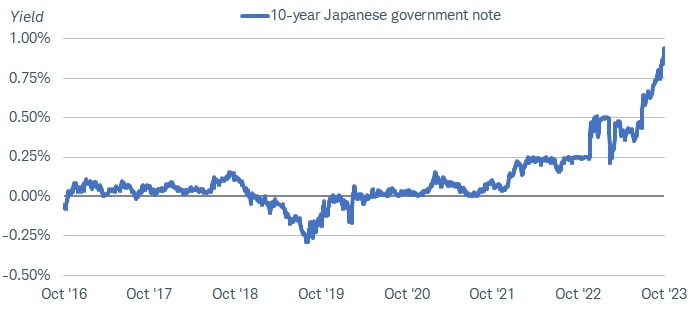
Source: Bloomberg, using daily data as of 10/31/2023.
Generic Japan 10 Year Government Bond (GTJPY10 Govt). Past performance is no guarantee of future results.
The rise in Treasury yields doesn't seem to be driven by rising inflation expectations or expectations for additional rate hikes. The yield difference between Treasury Inflation-Protected Securities (TIPS) and Treasuries, known as the "breakeven inflation rate," is a useful market-based inflation expectations gauge (it's the rate that inflation would need to average over the life of the TIPS for it to outperform a traditional Treasury). After rising sharply in 2021 and 2022, the 10-year and five-year breakeven inflation expectations have been hovering below 2.5% for months. While there are a number of factors pulling up Treasury yields, inflation expectations don't appear to be one of them.
Inflation expectations have generally held below 2.5% for the past few months
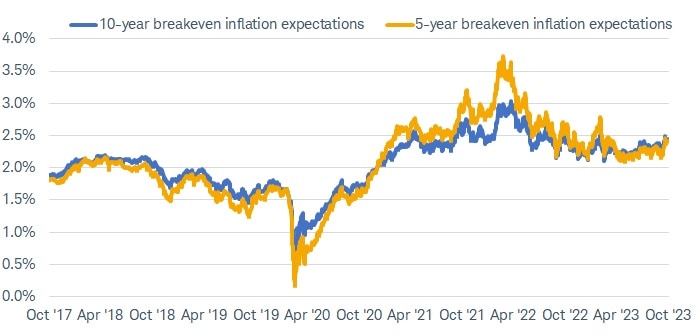
Source: Bloomberg, using daily data as of 10/31/2023.
US Breakeven 5 Year (USGGBE05 Index) and US Breakeven 10 Year (USGGBE10 Index).
5. What about the rising budget deficit? Isn't that why yields are rising so much?
The large budget deficit, and the accompanying increase in Treasury supply, may be playing a role in the recent rise, but it's likely one factor of many. We don't expect budget deficit or Treasury supply concerns to pull up yields even more.
It's easy to point to the rising supply of Treasuries as the culprit—the federal deficit was $1.7 trillion in the 12 months ending September 2023, and rising Treasury issuance is needed to fund that deficit. In addition, the Treasury had to increase its auction schedule after the debt ceiling dispute, adding substantial supply at a time when the Fed has stepped back from purchasing Treasuries.
The Fed's "quantitative tightening" process has continued as scheduled, and the amount of Treasuries held on its balance sheet has shrunk by more than $850 billion, to $4.9 trillion at the end of October 2023 from nearly $5.8 trillion in June 2022. This dynamic of rising supply and the loss of a price-insensitive buyer has added to upward pressure on yields. With the Fed buying less, yields may have needed to adjust a bit higher to attract new buyers.
There's a lot of logic to this explanation, but it doesn't tell the whole story. The rising deficit wasn't really a surprise, so the market should have known how it would be funded. More importantly, there just hasn't been much of a relationship between government deficits or Treasury supply and the level or change in Treasury yields. There also hasn't been much of a relationship with the amount of debt outstanding relative to gross domestic product (GDP) either, as the chart below highlights. Treasury yields were generally trending lower for 40 years despite the fact that the amount of U.S. debt continued to rise.
U.S. debt has been rising for years while Treasury yields generally trended lower
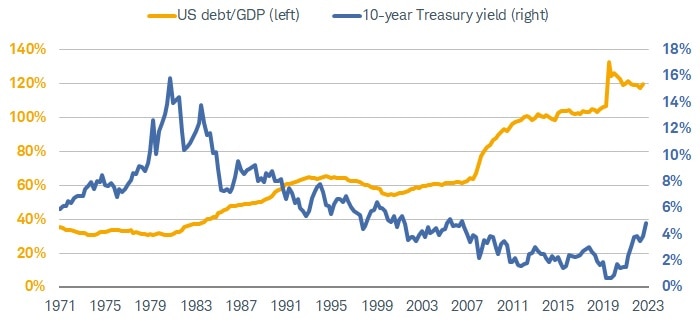
urce: Bloomberg, using quarterly data as of 10/31/2023 for the 10-year Treasury yield and as of 2Q23 for debt to GDP.
US Generic Govt 10 Yr (USGG10YR Index) and Federal Debt Total Public Debt as Pct of GDP Quarterly Seasonally Adjusted (FDTGATPD Index). Past performance is no guarantee of future results.
While it may have played a role over the last few months, we don't expect concerns about the deficit to be the key driver of yields going forward. It will likely play a contributing role, but we expect it to be driven by growth and inflation expectations, and the expected path of the fed funds rate.
What to do now
We suggest viewing the recent rise in yields as an opportunity. Treasury yields—and yields of many other fixed income investments, for that matter—haven't been this high in years. Waiting for yields to move even higher is a way of timing the market, and that's never something we suggest.
Remember that coupon income is a key driver of total returns over time, not price appreciation, and investors can earn high income today without taking much risk. Yields continue to fluctuate in the near term, rising or falling based on an ever-changing economic outlook, so prices can fluctuate as well. But one of the best features of individual bonds is that they mature, so those price changes are temporary as long as you plan to hold to maturity.
1 Bloomberg US Aggregate Bond Index total return of -2.7% from 12/31/2022 through 10/30/2023.
2 Source: US Treasury note, 1.25% coupon rate, 12/31/2026 maturity date. This note was issued on 12/31/2021 and was priced in the secondary market at $89.5 on 10/31/2023.
Find bonds that are right for you.
More from Charles Schwab
4 of Investors' Biggest Concerns Now
This Week's CPI Data and the State of the Economy
Schwab Market Perspective: Upside-Down
Related topics
Investors should consider carefully information contained in the prospectus, or if available, the summary prospectus, including investment objectives, risks, charges, and expenses. You can request a prospectus by calling 800-435-4000. Please read the prospectus carefully before investing.
The information provided here is for general informational purposes only and should not be considered an individualized recommendation or personalized investment advice. The investment strategies mentioned here may not be suitable for everyone. Each investor needs to review an investment strategy for his or her own particular situation before making any investment decision. All expressions of opinion are subject to change without notice in reaction to shifting market conditions. Data contained herein from third-party providers is obtained from what are considered reliable sources. However, its accuracy, completeness, or reliability cannot be guaranteed. Examples provided are for illustrative purposes only and not intended to be reflective of results you can expect to achieve.
All names and market data shown above are for illustrative purposes only and are not a recommendation, offer to sell, or a solicitation of an offer to buy any security. Supporting documentation for any claims or statistical information is available upon request.
Past performance is no guarantee of future results.
Investing involves risk, including loss of principal.
Fixed income securities are subject to increased loss of principal during periods of rising interest rates. Fixed income investments are subject to various other risks including changes in credit quality, market valuations, liquidity, prepayments, early redemption, corporate events, tax ramifications, and other factors. Lower rated securities are subject to greater credit risk, default risk, and liquidity risk.
Treasury Inflation Protected Securities (TIPS) are inflation-linked securities issued by the US Government whose principal value is adjusted periodically in accordance with the rise and fall in the inflation rate. Thus, the dividend amount payable is also impacted by variations in the inflation rate, as it is based upon the principal value of the bond. It may fluctuate up or down. Repayment at maturity is guaranteed by the US Government and may be adjusted for inflation to become the greater of the original face amount at issuance or that face amount plus an adjustment for inflation. Treasury Inflation-Protected Securities are guaranteed by the US Government, but inflation-protected bond funds do not provide such a guarantee.
A bond ladder, depending on the types and amount of securities within the ladder, may not ensure adequate diversification of your investment portfolio. This potential lack of diversification may result in heightened volatility of the value of your portfolio. As compared to other fixed income products and strategies, engaging in a bond ladder strategy may potentially result in future reinvestment at lower interest rates and may necessitate higher minimum investments to maintain cost-effectiveness. Evaluate whether a bond ladder and the securities held within it are consistent with your investment objective, risk tolerance and financial circumstances.
International investments involve additional risks, which include differences in financial accounting standards, currency fluctuations, geopolitical risk, foreign taxes and regulations, and the potential for illiquid markets. Investing in emerging markets may accentuate these risks.
Schwab does not recommend the use of technical analysis as a sole means of investment research.
The information and content provided herein is general in nature and is for informational purposes only. It is not intended, and should not be construed, as a specific recommendation, individualized tax, legal, or investment advice. Tax laws are subject to change, either prospectively or retroactively. Where specific advice is necessary or appropriate, individuals should contact their own professional tax and investment advisors or other professionals (CPA, Financial Planner, Investment Manager) to help answer questions about specific situations or needs prior to taking any action based upon this information.
Neither the tax-loss harvesting strategy, nor any discussion herein, is intended as tax advice and Charles Schwab & Co., Inc. does not represent that any particular tax consequences will be obtained. Tax-loss harvesting involves certain risks including unintended tax implications. Investors should consult with their tax advisors and refer to the Internal Revenue Service (IRS) website at www.irs.gov about the consequences of tax-loss harvesting.
Indexes are unmanaged, do not incur management fees, costs, and expenses and cannot be invested in directly. For more information on indexes please see schwab.com/indexdefinitions.
Diversification strategies do not ensure a profit and do not protect against losses in declining markets.
The Schwab Center for Financial Research is a division of Charles Schwab & Co., Inc.
Source: Bloomberg Index Services Limited. BLOOMBERG® is a trademark and service mark of Bloomberg Finance L.P. and its affiliates (collectively “Bloomberg”). Bloomberg or Bloomberg’s licensors own all proprietary rights in the Bloomberg Indices. Neither Bloomberg nor Bloomberg’s licensors approves or endorses this material, or guarantees the accuracy or completeness of any information herein, or makes any warranty, express or implied, as to the results to be obtained therefrom and, to the maximum extent allowed by law, neither shall have any liability or responsibility for injury or damages arising in connection therewith.
1123-3GJH