
The third quarter was very tough for bond investors as yields surged and prices—which move inversely to yields—dropped. The selloff was led by intermediate- and long-term Treasury bonds, whose yields rose to the highest levels in more than a decade. Only very short-duration fixed income investments managed to post gains.
The rout was somewhat surprising, as it came against a backdrop of the Federal Reserve's decision to skip a rate hike at its September policymaking meeting, easing inflation pressures, and concerns about slowing global growth—especially in China and Germany, two of the world's largest economies. These are generally factors that are positive for bond prices.
Third-quarter returns by fixed income asset class
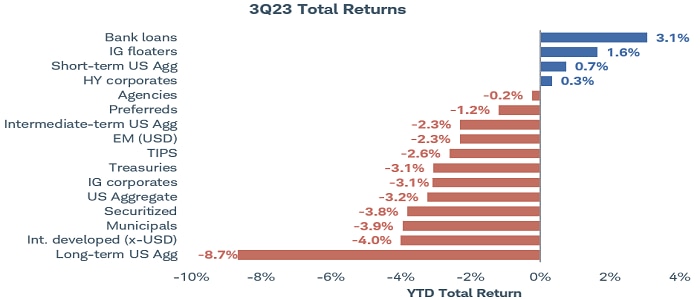
Source: Bloomberg. Total returns from 6/30/2023 through 9/29/2023.
Total return assumes reinvestment of interest and capital gains. Indexes are unmanaged, do not incur management fees, costs, and expenses and cannot be invested in directly. For more information on indexes please see schwab.com/indexdefinitions. Indexes representing the investment types are: Bank Loans = Morningstar LSTA U.S. Leveraged Loan 100 Index; IG floaters = Bloomberg US Floating-Rate Notes Index; Short-term US Agg = Bloomberg U.S. Aggregate 1-3 Years Bond Index; HY corporates = Bloomberg US High-Yield Very Liquid (VLI) Index; Agencies = Bloomberg U.S. Agency Index; Preferreds = ICE BofA Fixed Rate Preferred Securities Index; Intermediate-term US Agg = Bloomberg U.S. Aggregate 5-7 Years Bond Index; EM (USD) = Bloomberg Emerging Markets USD Aggregate Bond Index; TIPS = Bloomberg US Treasury Inflation-Protected Securities (TIPS) Index; Treasuries = Bloomberg US Treasury Bond Index; IG corporates = Bloomberg US Corporate Bond Index; US Aggregate = Bloomberg US Aggregate Bond Index; Securitized = Bloomberg US Securitized Bond Total Return Index; Municipals = Bloomberg US Municipal Bond Index; Int. developed (x-USD) = Bloomberg Global Aggregate ex-USD Index; Long-term US Agg = Bloomberg U.S. Aggregate 10+ Years Bond Index. Past performance is no guarantee of future results.
"Higher for longer" raises the term premium
While many explanations have been offered—a resilient economy, increasing budget deficits to fund, inflation fears, and lack of foreign demand among them—the evidence points to a different reason.
The culprit for the market's poor performance is the term premium—the extra yield that investors demand to tie up their money in longer-term bonds versus holding short-term bonds and reinvesting them. In other words, it's the risk premium that compensates investors for the possibility that the path of short-term interest rates diverges from what's discounted in the market.
During the third quarter, nearly the entire rise in Treasury yields was attributable to the rise in the term premium. Notably, the term premium for 10-year Treasuries is now positive for the first time since early 2021. As the Fed signals it will keep interest rates higher for longer, the market appears to be reflecting the uncertainty about the path of policy going forward. How much higher for how much longer?
10-year Treasury estimated term premium
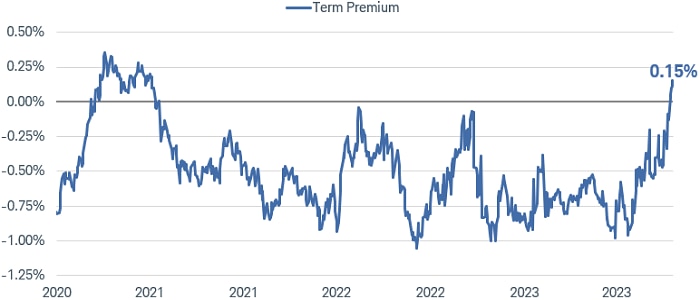
Source: Federal Reserve Bank of New York. Monthly data as of 9/29/2023.
The term premium is the compensation that investors require for bearing the risk that short-term Treasury yields do not evolve as they expected. The term premium is obtained from a statistical model developed by New York Federal Reserve Bank economists Tobias Adrian, Richard K. Crump, and Emanuel Moench. Past performance is no guarantee of future results.
Not surprisingly, spikes in the term premium have often occurred during periods of volatility in the bond market. The more uncertain investors are about where short-term interest rates are going, the more yield they demand to take on duration risk.
In this case, the market appears to be adjusting to a new world of higher short-term policy rates from central banks, with the federal funds rate holding at 5.5% this year and staying at 5% or higher throughout next year. That expectation is pulling intermediate- and long-term rates higher. The market is getting more closely aligned with the Fed's forecasts released at the September Federal Open Market Committee meeting, which indicate a median expectation that the federal funds rate will be lowered by 50 basis points (i.e., 0.50%) in 2024 and trend down to about 3% longer term. However, these forecasts have shifted rapidly over the past two years, keeping investors cautious.
Looking ahead to Q4
The uptrend in yields could continue as long as the economy and/or financial markets don't have an adverse reaction to Fed tightening. A move toward 5% in 10-year Treasury yields can't be ruled out. However, we see room for yields to fall longer term. A lot of potential negative news appears to be discounted at current yields. Real interest rates—adjusted for inflation expectations—are at the highest levels since 2008, which should dampen business and consumer spending and mitigate some of the risks associated with holding intermediate- to long-term bonds.
Most notably, inflation is trending lower. The benchmark inflation measure that the Fed uses in setting policy—the deflator for personal consumption expenditures excluding food and energy—has posted very modest increases over the last few months. On a three-month rate-of-change basis, it is near the Fed's 2% inflation target.
Inflation is nearing the Fed's 2% target
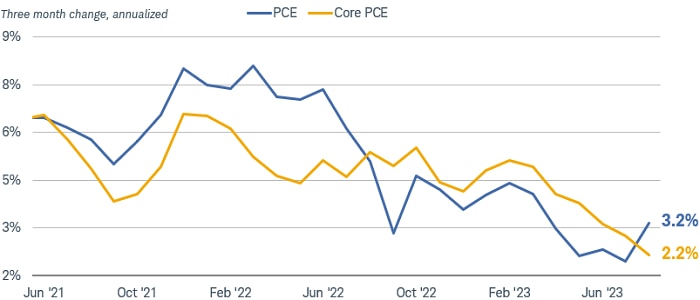
Source: Bloomberg, using monthly data as of August 2023.
US Personal Consumption Expenditures Chain Type Price Index SA (PCE DEF Index) and US Personal Consumption Expenditure Core Price Index MoM SA (PCE CORE Index). Personal Consumption Expenditures (PCE) includes a measure of consumer spending on goods and services among households in the U.S. The PCE is used as a mechanism to gauge how much earned income of households is being spent on current consumption for various goods and services. Core PCE excludes food and energy prices, which tend to be volatile.
With inflation cooling and yields moving in line with the Fed's projections, the worst of the bond market selloff should be behind us. The Fed is signaling one more rate hike at the most, depending on how the labor market and inflation look. In past cycles, yields have typically fallen in the 12 months after the peak in the federal funds rate. Moreover, returns for intermediate-term bonds have outperformed short-term bonds due to the higher starting yields.
Intermediate-term bonds have outperformed short-term bonds when the Fed is close to done hiking rates
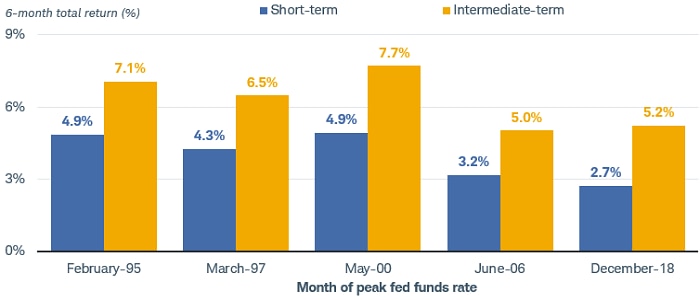
Source: Bloomberg, as of 2/28/2023, using monthly data.
Total return assumes reinvestment of interest and capital gains. Six-month total returns for each period as of month-end. The indexes used for each asset class are: Short-term = Bloomberg US Aggregate 1-3 Years Index; Intermediate-term = Bloomberg US Aggregate 5-7 Years Index. Indexes are unmanaged, do not incur management fees, costs, and expenses and cannot be invested in directly. For more information on indexes please see schwab.com/indexdefinitions. Past performance is no guarantee of future results.
One factor supporting the outlook for total returns is that starting yields are so much higher than they have been for many years. The coupon income can mitigate the impact of price changes. Another way to look at the current market is to assess the potential total returns for bonds of different maturities, given a change in yields over the next 12 months. If yields hold steady, then returns over the next year should be in the 4.5% to 5.1% region depending on maturity. A move up of 50 basis points from current levels would still produce positive returns for all but 30-year bonds. Meanwhile, a decline of 50 basis points should produce positive returns, all else being equal.
Total return estimates for various maturities based on change in yields
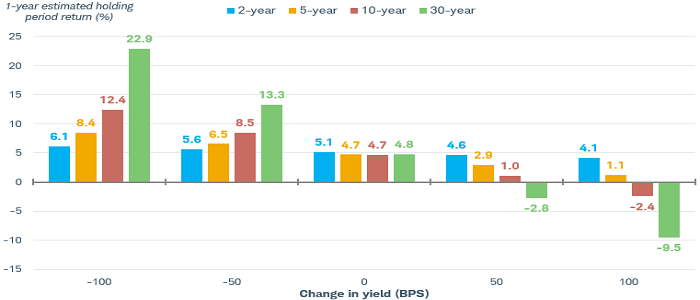
Source: Schwab Center for Financial Research, as of 10/4/23.
The example is hypothetical and provided for illustrative purposes only. The chart shows the hypothetical 1-year holding period return assuming an investor buys a 2-, 5-, 10-, or 30-year Treasury and interest rates change by -100, -50, 0, 50, or 100 basis points. The hypothetical examples assume the investor receives the coupon income but does not reinvest it. Hypothetical total returns assume price appreciation or depreciation. Outcomes are not guaranteed. Examples provided are for illustrative purposes only and not intended to be reflective of results you can expect to achieve. Basis points (BPS) represent one-hundredth of one percent.
We tend to use the Bloomberg US Aggregate Bond index as our benchmark when looking at duration. It currently has a yield-to-worst1 of 5.5% with an average duration of 6.2. For investors looking to generate income without taking a lot of credit risk, we think a benchmark allocation can make sense.
Overall, the lesson of the third-quarter bond market selloff is that volatility is likely to be higher going forward than it was for much of the past decade. As the Fed and other major central banks step back from their zero-interest-rate policies, investors are demanding higher risk premia to compensate for the uncertainty about the direction and level of rates longer term. This new normal is challenging for anyone trying to time the market but also opens up opportunities for long-term investors.
We continue to suggest using strategies like bond ladders (a portfolio of individual bonds that mature on different dates) to avoid trying to time the interest rate market and to use the recent rise in yields as an opportunity to add intermediate term duration bonds to add income to fixed income portfolios. At current yields, the risk/reward looks attractive to us for investors with a longer time horizon.
1 Yield-to-worst is a measure of the lowest possible yield that can be received on a bond that fully operates within the terms of its contract without defaulting. It is a type of yield that is referenced when a bond has provisions that would allow the issuer to close it out before it matures.
Find bonds that are right for you.
More from Charles Schwab
4 of Investors' Biggest Concerns Now
This Week's CPI Data and the State of the Economy
Schwab Market Perspective: Upside-Down
Related topics
The information provided here is for general informational purposes only and should not be considered an individualized recommendation or personalized investment advice. The investment strategies mentioned here may not be suitable for everyone. Each investor needs to review an investment strategy for his or her own particular situation before making any investment decision. All expressions of opinion are subject to change without notice in reaction to shifting market conditions. Data contained herein from third-party providers is obtained from what are considered reliable sources. However, its accuracy, completeness, or reliability cannot be guaranteed. Examples provided are for illustrative purposes only and not intended to be reflective of results you can expect to achieve.
Past performance is no guarantee of future results.
Investing involves risk, including loss of principal.
Fixed income securities are subject to increased loss of principal during periods of rising interest rates. Fixed income investments are subject to various other risks including changes in credit quality, market valuations, liquidity, prepayments, early redemption, corporate events, tax ramifications, and other factors. Lower rated securities are subject to greater credit risk, default risk, and liquidity risk.
Forecasts contained herein are for illustrative purposes only, may be based upon proprietary research and are developed through analysis of historical public data.
Indexes are unmanaged, do not incur management fees, costs, and expenses and cannot be invested in directly. For more information on indexes please see schwab.com/indexdefinitions.
The Bloomberg U.S. Aggregate 1-3 Years Index tracks bonds with 1-3 year maturities within the flagship US Aggregate Bond Index.
The Bloomberg U.S. Treasury Inflation Protected Securities (TIPS) Index ("TIPS") is a market value-weighted index that tracks inflation-protected securities issued by the U.S. Treasury. To prevent the erosion of purchasing power, TIPS are indexed to the non-seasonally adjusted Consumer Price Index for All Urban Consumers, or the CPI-U (CPI).
The Bloomberg U.S. Aggregate 5-7 Years Index tracks bonds with 5-7 year maturities within the flagship US Aggregate Bond Index.
The Bloomberg U.S. Aggregate 10 Years or Higher Index tracks bonds with 10+ year maturities within the flagship US Aggregate Bond Index.
Treasury Inflation Protected Securities (TIPS) are inflation-linked securities issued by the US Government whose principal value is adjusted periodically in accordance with the rise and fall in the inflation rate. Thus, the dividend amount payable is also impacted by variations in the inflation rate, as it is based upon the principal value of the bond. It may fluctuate up or down. Repayment at maturity is guaranteed by the US Government and may be adjusted for inflation to become the greater of the original face amount at issuance or that face amount plus an adjustment for inflation. Treasury Inflation-Protected Securities are guaranteed by the US Government, but inflation-protected bond funds do not provide such a guarantee.
Tax-exempt bonds are not necessarily a suitable investment for all persons. Information related to a security's tax-exempt status (federal and in-state) is obtained from third parties, and Charles Schwab & Co., Inc. does not guarantee its accuracy. Tax-exempt income may be subject to the Alternative Minimum Tax (AMT). Capital appreciation from bond funds and discounted bonds may be subject to state or local taxes. Capital gains are not exempt from federal income tax.
Preferred securities are a type of hybrid investment that share characteristics of both stock and bonds. They are often callable, meaning the issuing company may redeem the security at a certain price after a certain date. Such call features, and the timing of a call, may affect the security's yield. Preferred securities generally have lower credit ratings and a lower claim to assets than the issuer's individual bonds. Like bonds, prices of preferred securities tend to move inversely with interest rates, so their prices may fall during periods of rising interest rates. Investment value will fluctuate, and preferred securities, when sold before maturity, may be worth more or less than original cost. Preferred securities are subject to various other risks including changes in interest rates and credit quality, default risks, market valuations, liquidity, prepayments, early redemption, deferral risk, corporate events, tax ramifications, and other factors.
Bank loans typically have below investment-grade credit ratings and may be subject to more credit risk, including the risk of nonpayment of principal or interest. Most bank loans have floating coupon rates that are tied to short-term reference rates like the Secured Overnight Financing Rate (SOFR), so substantial increases in interest rates may make it more difficult for issuers to service their debt and cause an increase in loan defaults. A rise in short-term references rates typically result in higher income payments for investors, however. Bank loans are typically secured by collateral posted by the issuer, or guarantees of its affiliates, the value of which may decline and be insufficient to cover repayment of the loan. Many loans are relatively illiquid or are subject to restrictions on resales, have delayed settlement periods, and may be difficult to value. Bank loans are also subject to maturity extension risk and prepayment risk.
Diversification and asset allocation strategies do not ensure a profit and cannot protect against losses in a declining market.
A bond ladder, depending on the types and amount of securities within the ladder, may not ensure adequate diversification of your investment portfolio. This potential lack of diversification may result in heightened volatility of the value of your portfolio. As compared to other fixed income products and strategies, engaging in a bond ladder strategy may potentially result in future reinvestment at lower interest rates and may necessitate higher minimum investments to maintain cost-effectiveness. Evaluate whether a bond ladder and the securities held within it are consistent with your investment objective, risk tolerance and financial circumstances.
International investments involve additional risks, which include differences in financial accounting standards, currency fluctuations, geopolitical risk, foreign taxes and regulations, and the potential for illiquid markets. Investing in emerging markets may accentuate these risks.
Supporting documentation for any claims or statistical information is available upon request.
The Schwab Center for Financial Research is a division of Charles Schwab & Co., Inc.
Source: Bloomberg Index Services Limited. BLOOMBERG® is a trademark and service mark of Bloomberg Finance L.P. and its affiliates (collectively "Bloomberg"). Bloomberg or Bloomberg's licensors own all proprietary rights in the Bloomberg Indices. Neither Bloomberg nor Bloomberg's licensors approves or endorses this material, or guarantees the accuracy or completeness of any information herein, or makes any warranty, express or implied, as to the results to be obtained therefrom and, to the maximum extent allowed by law, neither shall have any liability or responsibility for injury or damages arising in connection therewith.
1023-3SHU