
Beginning traders can sometimes feel unsure where to start when they first log in to a trading platform like thinkorswim®. Learning how to use basic trading tools can help beginners create a potentially more effective trading strategy. Here are common questions new users ask when first learning how to use the thinkorswim trading platform.
1. How can I add studies to my charts?
One way to add context to a chart is with the help of studies. Studies overlay additional data that some traders use to find potential trends and attempt to identify entry and exit points for trades.
The thinkorswim platform includes more than 300 studies that can be added to charts. The various studies can be added to charts via the Studies tab.
An example of a relatively simple study is the 30-day moving average, which is the average of closing prices over the past 30 days. Some traders use this indicator to gauge the general direction of prices in the short term.
To add the Simple Moving Average indicator on thinkorswim, select the Charts tab and enter a symbol to bring up a price chart. One way to add a moving average is to select Studies, then Add study > Moving Averages > SimpleMovingAvg. The default is a 9-period moving average. To change it to the 30-day moving average, return to the Studies drop-down and select Edit studies. In the Edit Studies and Strategies window, select the gear icon next to the SimpleMovingAvg and a SimpleMovingAvg Customizing window will open. Edit the length of the moving average from 9 to 30, then select OK on the next two windows.
It's also possible to add multiple moving averages and alter their appearance using customization features. In the SimpleMovingAvg Customizing window, you can change the style, width, and color of the moving average. To add more moving averages to the chart, follow the same process used to apply the 30-day moving average, then customize the period and appearance so you can easily identify each one.
Adding indicators to price charts
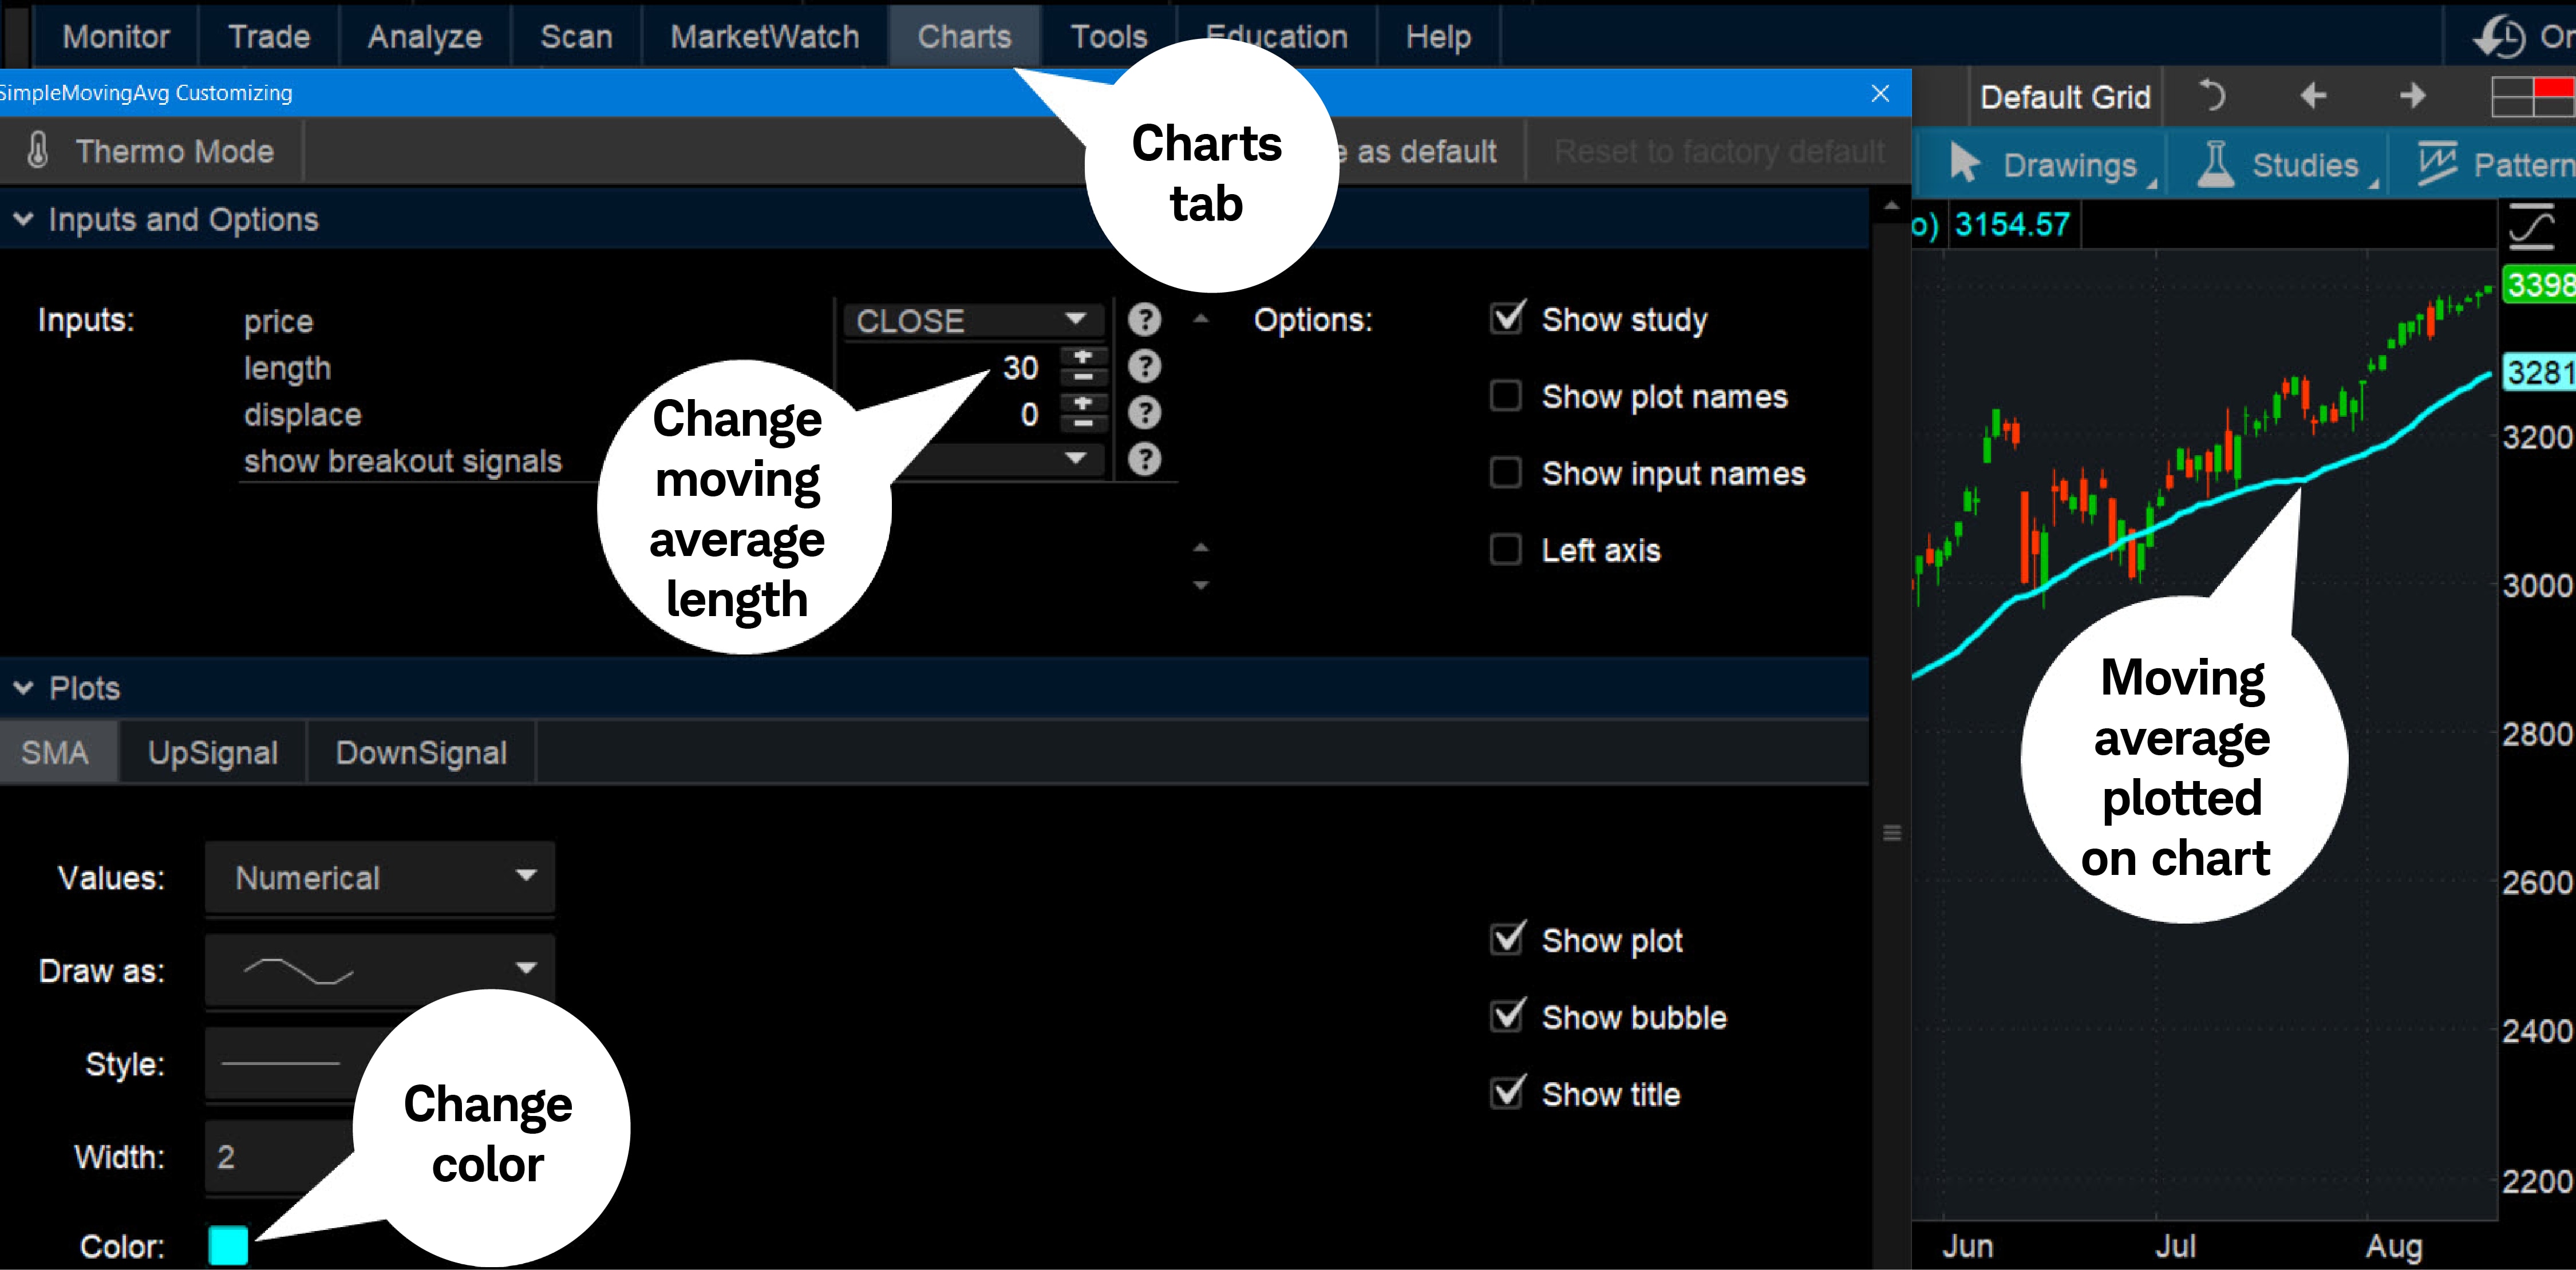
Source: thinkorswim platform
For illustrative purposes only. Past performance does not guarantee future results.
2. How can I set up and save watchlists?
Traders often use watchlists to help them identify potential opportunities. Traders can use these lists to generate trade ideas or to find stocks with a certain type of activity. For example, a trader might be looking for stocks going up or down, a stock with upcoming earnings or dividends, or stocks with percentage changes (gainers or losers). Traders can get started by perusing the menu located along the top of the Watchlist gadget.
The thinkorswim platform offers pre-populated watchlists containing symbols that share similar characteristics, which can be accessed on the left sidebar of the platform. You can choose from public watchlists under <select watchlist> from the resulting drop-down menu. From the drop-down, there's also Create watchlist. By selecting Create watchlist, a New Watchlist window opens, and you can name it, add symbols, and customize the order. Once satisfied, select Save. You can then find the saved watchlist under Personal, then <select watchlist>.
Watchlists can be linked to a chart. This allows you to quickly see the chart of each symbol on your list. If you have multiple moving averages displayed on your chart and you're looking for a moving average crossover, for example, you can quickly scroll through the charts of all the symbols on your watchlist to spot any crossovers.
Another way to create or open a watchlist is by using the Select gadget (plus sign) button along the bottom of the left sidebar, then select Watchlist. To select a specific list, use the menu along the top of the Watchlist gadget.
3. How do I place trades?
There are different ways to place orders and different order types. As traders become more experienced, they can choose the order types and process that best suits their trading style and objective. One basic way to set up a trade is with the order ticket. On the Trade tab, select the price next to a symbol and Order Entry Tools will appear at the bottom of the platform. From there, you can choose whether to buy or sell, set a number of shares, and choose the type of order, such as market or limit. Once the order is set up, select Confirm and Send to enter the order.
Another choice is the Active Trader ladder, which is designed to be a fast way to enter trades on stocks, exchange-traded funds, futures, and forex.
From the Trade tab, select Active Trader. A chart appears on the left and the active ladder on the right. To place a trade, select the price from the ladder or use the Buy MKT and Sell MKT buttons. The trade will display on the chart. When you adjust the price on the chart, the shading on the ladder moves as well. Once you select a price, the Order Confirmation Dialog appears at the bottom. Confirm that the trade looks accurate and select Send.
To customize an order template, select the settings gear icon. From the Customize window, select to display Order Template Editor and Order Template Selector. Then a trader can select the order template from the list before they place a trade.
Placing a trade using the active ladder
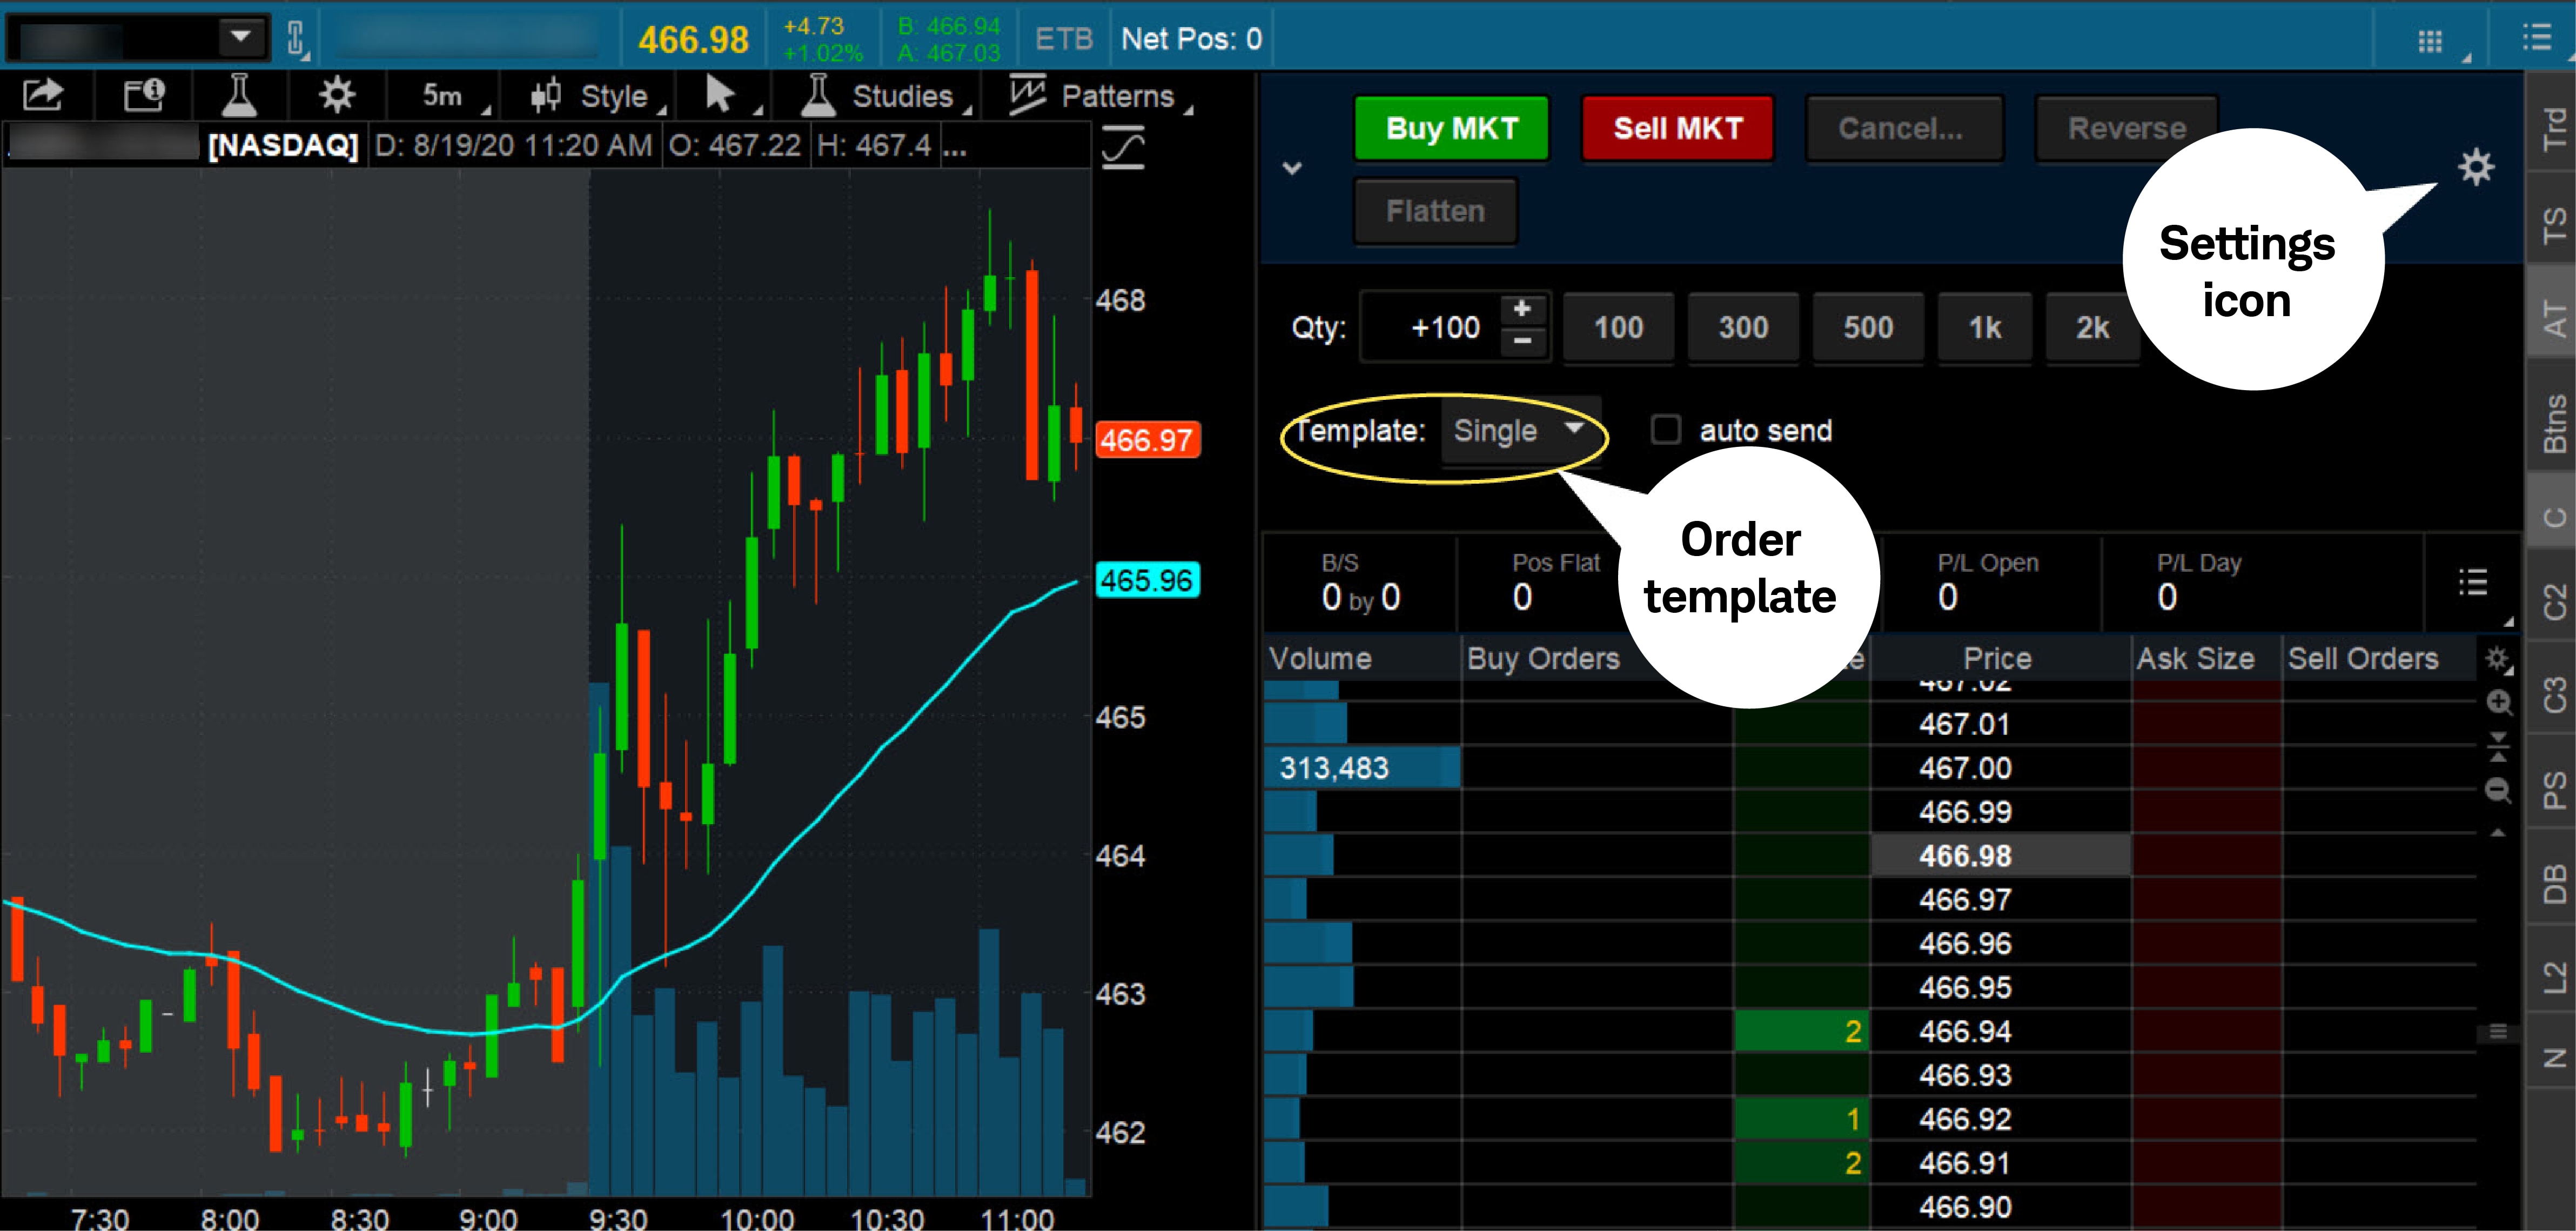
Source: thinkorswim platform
For illustrative purposes only. Past performance does not guarantee future results.
4. How do I place options trades?
Qualified traders interested in trading options can set up the Option Chain. In the Trade tab, under All Products, enter a ticker symbol in the symbol box to see a detailed quote for the underlying symbol. Below that is a list of options expirations, including the expiration date, days to expiration in parentheses, multiplier, and expiration type, such as weekly, quarterly, or standard.
Next, set up the columns. Open one of the expirations. Select the Layout menu and choose from predefined column setups or customize your own.
For example, you might choose to add Mark, Probability OTM, and Delta for the column layout.
Next, from the Strikes list, choose how many strikes you want to see.
There are more than a dozen different types of orders, and your choice depends on the frequency and complexity of your trades. One potential starting point is to select the bid price to load a sell order and the ask price to load a buy order. This loads a limit order to the Order Entry window, which has default increments of 100 shares for stock trades and 10 contracts for options trades. These defaults can be customized to load trades with preferred quantities. More experienced traders might consider using other order types.
Placing options trades
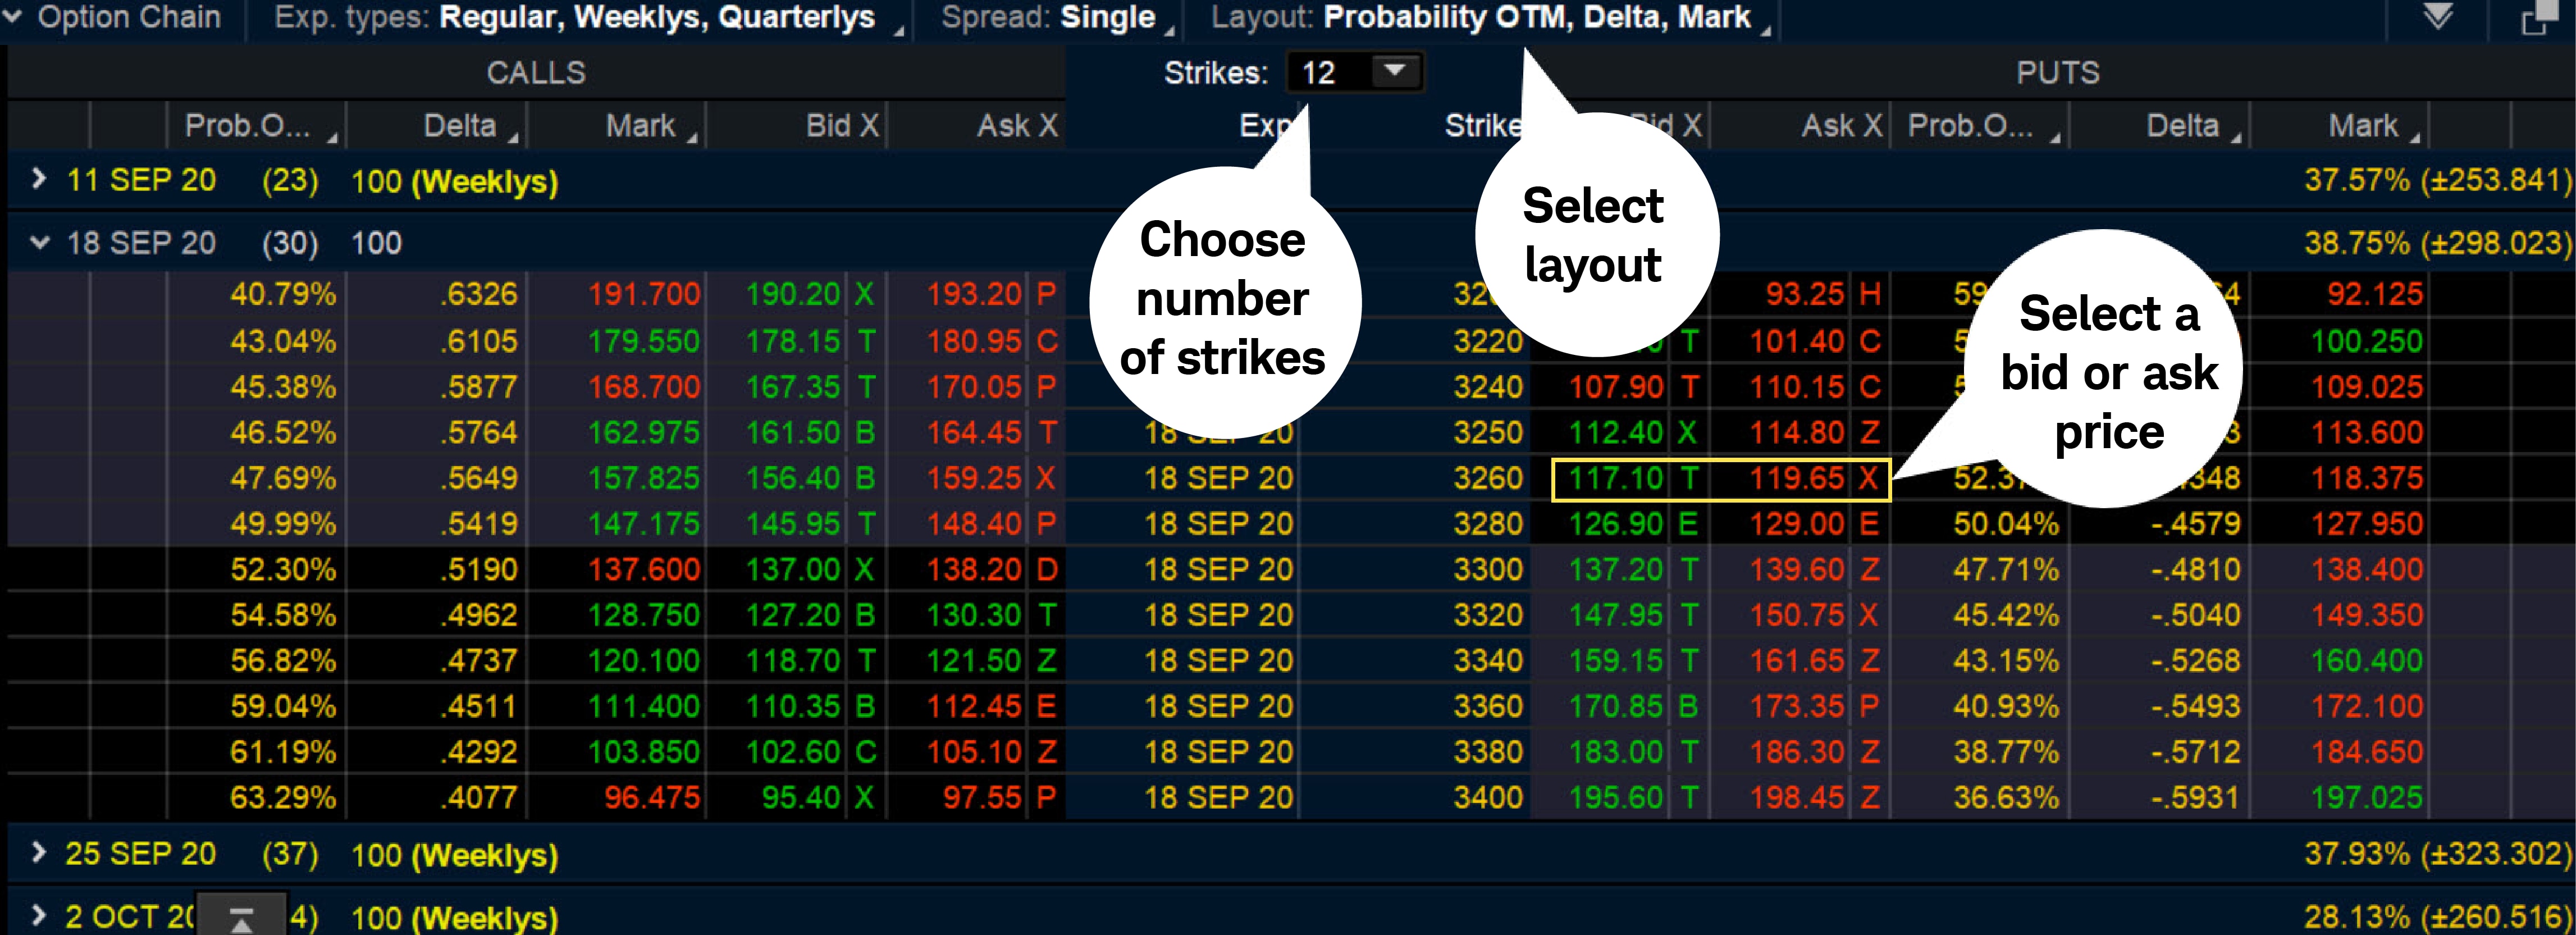
Source: thinkorswim platform
For illustrative purposes only. Past performance does not guarantee future results.
5. After placing trades, how do I keep track of my positions?
It's common for traders to have multiple positions open. Being able to monitor them can help traders make better decisions. It's possible to customize displayed information on the Account Statement found under the Monitor tab. It's possible to sort a portfolio by groups, such as dividend-paying stocks, growth stocks, or covered calls. You can also customize the columns to only see the information that’s relevant to you. For example, an option trader might choose trade price, net liquidating value, profit and loss percentage, and days to expiration.
From the Monitor tab, select Account Statement. Under Profits and Losses, select by Symbol, by Positions Group, or Overall. To customize columns, select the gear settings icon on the far right and choose the items you want to display in the Customize Profits and Losses window.
Learning how to navigate charts, create watchlists, place orders, and monitor positions can potentially give traders the confidence to begin using the thinkorswim platform. After learning how to use these basic tools, traders can explore more features as they expand their knowledge of the platform and the features and tools it offers.
Schwab offers trading tools and platforms.
More from Charles Schwab
Looking to the Futures
Today's Options Market Update
The Truth About Corporate Stock Earnings Estimates
Related topics
The information provided here is for general informational purposes only and should not be considered an individualized recommendation or personalized investment advice. The investment strategies mentioned here may not be suitable for everyone. Each investor needs to review an investment strategy for his or her own particular situation before making any investment decision.
Options carry a high level of risk and are not suitable for all investors. Certain requirements must be met to trade options through Schwab. Please read the Options Disclosure Document titled "Characteristics and Risks of Standardized Options" before considering any options transaction. Supporting documentation for any claims or statistical information is available upon request.
Covered calls provide downside protection only to the extent of the premium received and limit upside potential to the strike price plus premium received.
All expressions of opinion are subject to change without notice in reaction to shifting market conditions. Data contained herein from third-party providers is obtained from what are considered reliable sources. However, its accuracy, completeness, or reliability cannot be guaranteed.
Examples provided are for illustrative purposes only and not intended to be reflective of results you can expect to achieve.
0723-3GAG