
Even veteran traders sometimes feel shy jumping into a stock on one particular day each quarter: the day of the company's earnings report. Stocks often see sharp moves around the announcement, as investors react to the results and how those numbers compare to estimates or expectations. A positive surprise can drive a stock higher, while disappointing results can send it suddenly lower. The volatility can lead to potential opportunity but also risk that some traders might rather avoid.
Although there's no guarantee a trader will be on the right side of a trade when a company reports earnings, some approaches are designed to help address the related trading turbulence and perhaps even take advantage of the volatility.
Assuming a trader feels ready to take on the ups and downs of trading an earnings report, it's important to consider a slow and methodical approach in regard to earnings announcements. Traders might have to adjust their normal trading strategy to deal with an added level of complexity during earnings season.
One way to trade earnings: Don't
The first thing a trader should consider before trading around earnings reports is whether they're prepared to take on the trade's associated risk. For some traders, it can sometimes be better to stay away from the ebbs and flows of earnings season and wait until the dust settles. At the end of an earnings period, traders can sort through the numbers, guidance, and conference call transcripts and then decide if they still want to trade or own the stock.
Also, long-term investors may have a better chance of building wealth over the years by not trying to time the market or make trades based on short-term metrics like one or two quarterly earnings reports.
On the other hand, being patient and waiting out earnings season isn't necessarily the rule. Here are some considerations to keep in mind when trading around earnings reports.
Options prices and earnings announcements
Before trading a stock on the company's earnings day (or on any day for that matter), bear in mind that not all accounts qualify for options trading. Also, an options trader entering a position ahead of an earnings report should be comfortable with the uncertainty about any subsequent move in the underlying stock. For example, if speculating on the post-earnings direction of the underlying stock by buying a put or call, the risk to being wrong is typically the premium paid for that option.
Selling naked options, on the other hand, might not be the best strategy because such strategies have unlimited risk. Instead, many traders prefer a strategy that can help cut losses if they're wrong but still reward if they're right.
Developing a strategy around earnings sometimes means getting familiar with a stock's implied volatility1(IV), which can be found on the thinkorswim® trading platform. Navigate to the Trade tab and then enter a stock symbol. Next, select Option Chain and scroll down to Today's Options Statistics. The third item on the list is Current IV Percentile followed by a percentage (see image below). That's the number to consider keeping a close eye on starting a few weeks before earnings and right up until reporting day.
Example of Today's Options Statistics on the thinkorswim platform
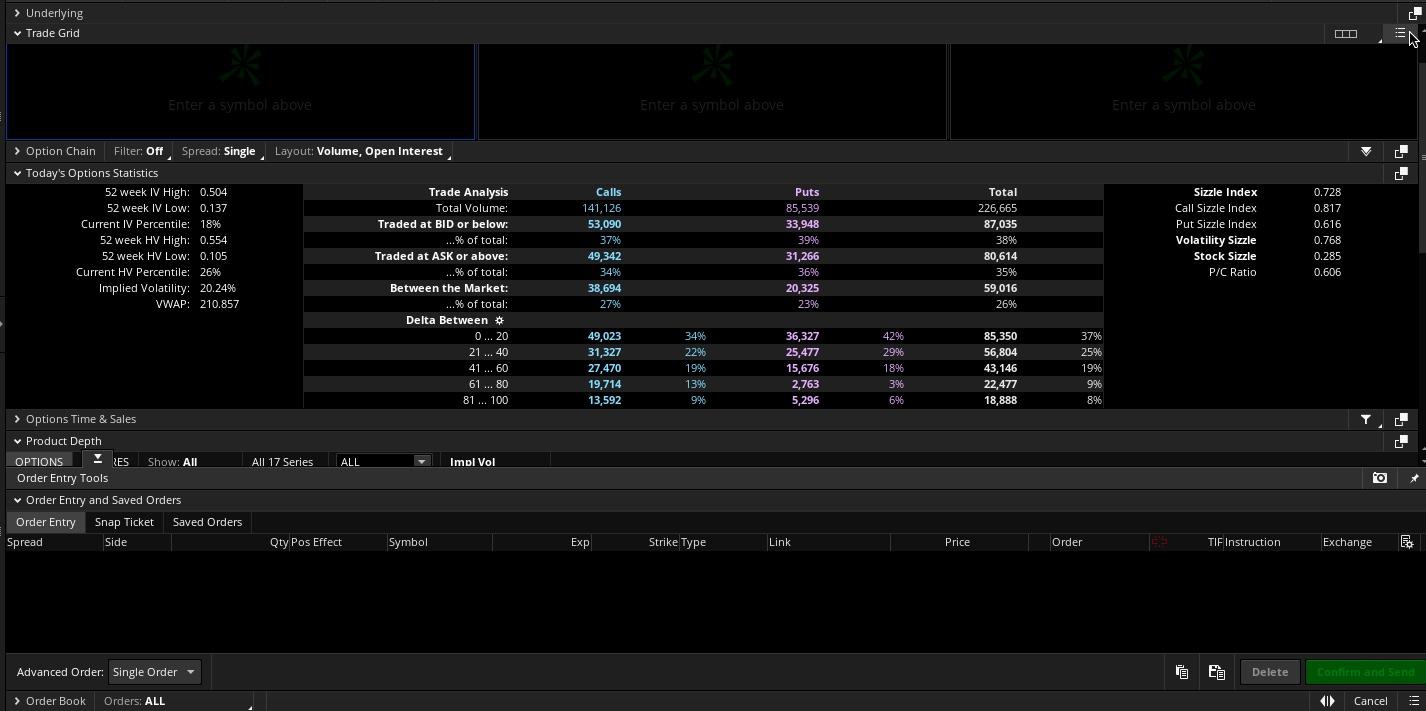
Source: thinkorswim platform
The left column of Today's Options Statistics in the figure above illustrates several key aspects that might help a trader better understand how IV works. On the seventh line, you can see the current IV of the options currently trading. The top two lines contain the 52-week high IV and the 52-week low IV. The third line from the top holds the current IV percentile. This shows (in percentage form) how the current IV compares with its historic highs and lows. Knowing if an IV is high or low historically for a given stock can sometimes help traders weigh strategies for current volatility levels. Implied volatilities tend to be elevated when earnings announcements approach.
So, why does the current IV percentile matter?
For instance, a 20% IV for a $30 stock indicates traders think the stock might either rise or fall $6 from its current level, meaning a potential price range of between $24 and $36 throughout the course of the next year (because IV is an annualized number). Knowing this range can help develop a forecast for the stock and determine if it's a suitable candidate to trade.
IV plays a role in the value of an options contract. A higher IV means a higher options premium. This can be helpful to know in the immediate aftermath of earnings, when vanilla results can sometimes cause an IV collapse that removes value from the options contracts. Traders sometimes call the sudden drop in IV an implied volatility "crush," and it can cause the value of an option to fall even when the stock makes a move in the anticipated direction.
Some traders, for instance, trade long puts on a stock, and then can't understand why their trade lost money even though the stock went down following its earnings report. It's often because the IV collapsed, removing IV premium from the options.
Measuring implied earnings moves
Another metric to consider getting familiar with around earnings is the Market Maker Move (MMM), which is also found on thinkorswim. The MMM only appears when the IV on the front options expiration rises above the IV of the second options expiration. It tells traders the one-day expected move in the underlying stock and is based on what traders have priced into the options around the upcoming earnings release.
For example, going into an earnings report, a stock might have a MMM of 5%, which implies a potential post-earnings one-day move of 5% after the report. The calculations are theoretical, and a stock might see a move greater or less than the implied move. The MMM is merely an indicator of what is currently "priced in" to the options.
The MMM can also give traders a sense of where they might consider placing stops if they trade the underlying stock. For instance, if the MMM forecasts a 4% move, some traders might decide to place a stop 4% under the current stock value to help cut potential losses if the stock moves lower when they were expecting a move higher.
It can also be helpful to have a sense of how a stock moved around earnings historically. Traders can measure this historical movement on thinkorswim by selecting the Analyze tab, then Earnings. Traders can see how the stock performed versus IV over the past eight earnings periods (see image below). Knowing all this can be helpful, but remember, it's no guarantee of how a stock might perform on its next earnings date. A surprisingly bullish or bearish outcome can sometimes cause all this to go out the window.
Volatility and earnings
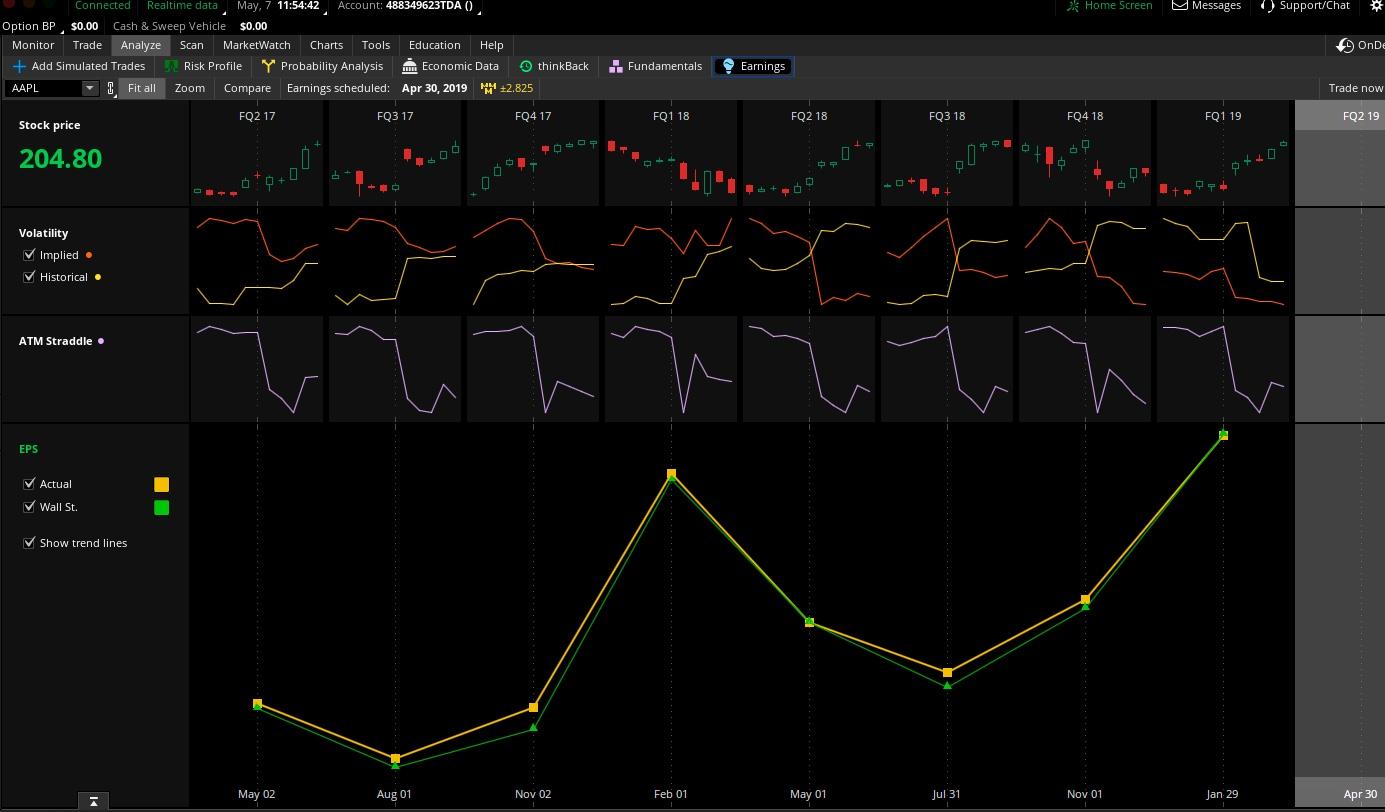
Source: thinkorswim platform
For illustrative purposes only. Not a recommendation of any security or strategy.
Fundamentally speaking
Although understanding the MMM and IV might help traders place options trades around an earnings event, they also need to have a deep knowledge of the stock they're trading before they begin trading on earnings day. That means digging into the fundamentals of a company and understanding what analysts expect to see and hear when the firm reports.
Within an earnings report, the earnings per share (EPS), revenue or sales, and forward guidance can all have implications for the company and its share price. For example, a company might report strong revenues and EPS, but the stock might react negatively to forward guidance.
A stock can decline immediately when a company reports earnings. That's why some traders try to stay on top of the news—and try to get a quick look at the numbers. Getting a sense ahead of time of the analysts' average earnings and revenue estimates (the average EPS estimate can be found on thinkorswim) can help traders understand the market's reaction to the results. Any guidance in its last earnings report for the current quarter can also have implications because failing to meet that guidance, or projecting guidance for the coming quarter that falls short of Wall Street analyst estimates, can often cause a stock price to dive.
Even if traders stay on top of all the news, events, and numbers, there's still the company's conference call to consider. The conference call can sometimes include important information not available in the earnings report, which can also have a quick short-term impact on the stock price.
1The market's perception of the future volatility of the underlying security directly reflected in the options premium. Implied volatility is an annualized number expressed as a percentage (such as 25%), is forward-looking, and can change.
Just getting started with options?
More from Charles Schwab
Looking to the Futures
Today's Options Market Update
The Truth About Corporate Stock Earnings Estimates
Related topics
The information provided here is for general informational purposes only and should not be considered an individualized recommendation or personalized investment advice. The investment strategies mentioned here may not be suitable for everyone. Each investor needs to review an investment strategy for his or her own particular situation before making any investment decision.
Options carry a high level of risk and are not suitable for all investors. Certain requirements must be met to trade options through Schwab. Please read the Options Disclosure Document titled "Characteristics and Risks of Standardized Options" before considering any option transaction. Supporting documentation for any claims or statistical information is available upon request.
Investing involves risk including loss of principal. With long options, investors may lose 100% of funds invested.
Uncovered options strategies involve potential for unlimited risk and must be done in margin accounts.
There is no guarantee that execution of a stop order will be at or near the stop price.
Probability analysis results from the Market Maker Move indicator are theoretical in nature, not guaranteed, and do not reflect any degree of certainty of an event occurring.
All expressions of opinion are subject to change without notice in reaction to shifting market conditions.
Examples provided are for illustrative purposes only and not intended to be reflective of results you can expect to achieve.
Past performance of a security does not guarantee future results or success.
Commissions, taxes and transaction costs are not included in this discussion, but can affect final outcome and should be considered. Please contact a tax advisor for the tax implications involved in these strategies.
0723-3A3M