
Markets are dynamic, with prices constantly moving, forming trends. Over time, market prices and trends change, sometimes moving faster than at other times.
Often, a trend is defined as the general direction of a market over the short, immediate, or long term. A technical tool known as a simple moving average1 (SMA) crossover can help traders identify the lion's share of a trend.
Some stock moves are short-lived, while others last for weeks, months, or even years. Using an SMA crossover system can help traders identify the direction of a market trend, as well as find potential entry and exit points to take advantage of market trends.
But before we explore how SMA crossover systems can potentially help traders identify trends, let's first look at what a moving average is and how trends are defined.
What is a moving average?
A moving average2 (MA) is a trend-following indicator that helps traders determine whether the "average" price in a given time period is trending up or down. Traders can see the movement of a stock's average price over time in relation to the actual stock price, which at times may trade above or below its MA line.
How are moving averages calculated? Let's look at the SMA formula using the 50-day average. To calculate it, add the stock's closing price from the last 50 days and divide the total by 50. Each day, the average changes because the oldest day is subtracted, while the current day's information is added.
Because the SMA is a lagging indicator, the crossover technique may not capture exact tops and bottoms. But it can help traders identify the bulk of a trend.
Basic trend definitions
Knowing some basic trend definitions can help traders understand what they're seeing as they read charts. Consider these basic guiding principles:
- Uptrend: If a stock price is above an SMA and that SMA is moving higher, it might indicate an uptrend.
- Downtrend: If the stock price is below the SMA and that SMA is moving lower, it might indicate a downtrend.
These principles are intended to help traders interpret the potential direction of a trend, not to definitively call its direction. If a stock price is above the SMA, and if the SMA is moving upward, then there may be a stronger likelihood that there's an uptrend—but it's not guaranteed. The reverse may be true for a downtrend. However, trends can change, and other indicators can also be used to interpret trend direction. They may even conflict with one another from time to time.
Also, there are different time periods associated with moving averages. It's possible to review a 10-day, 50-day, or 200-day SMA. The shorter the SMA, the shorter the trend it identifies, and vice versa (see the chart below).
SMA time periods
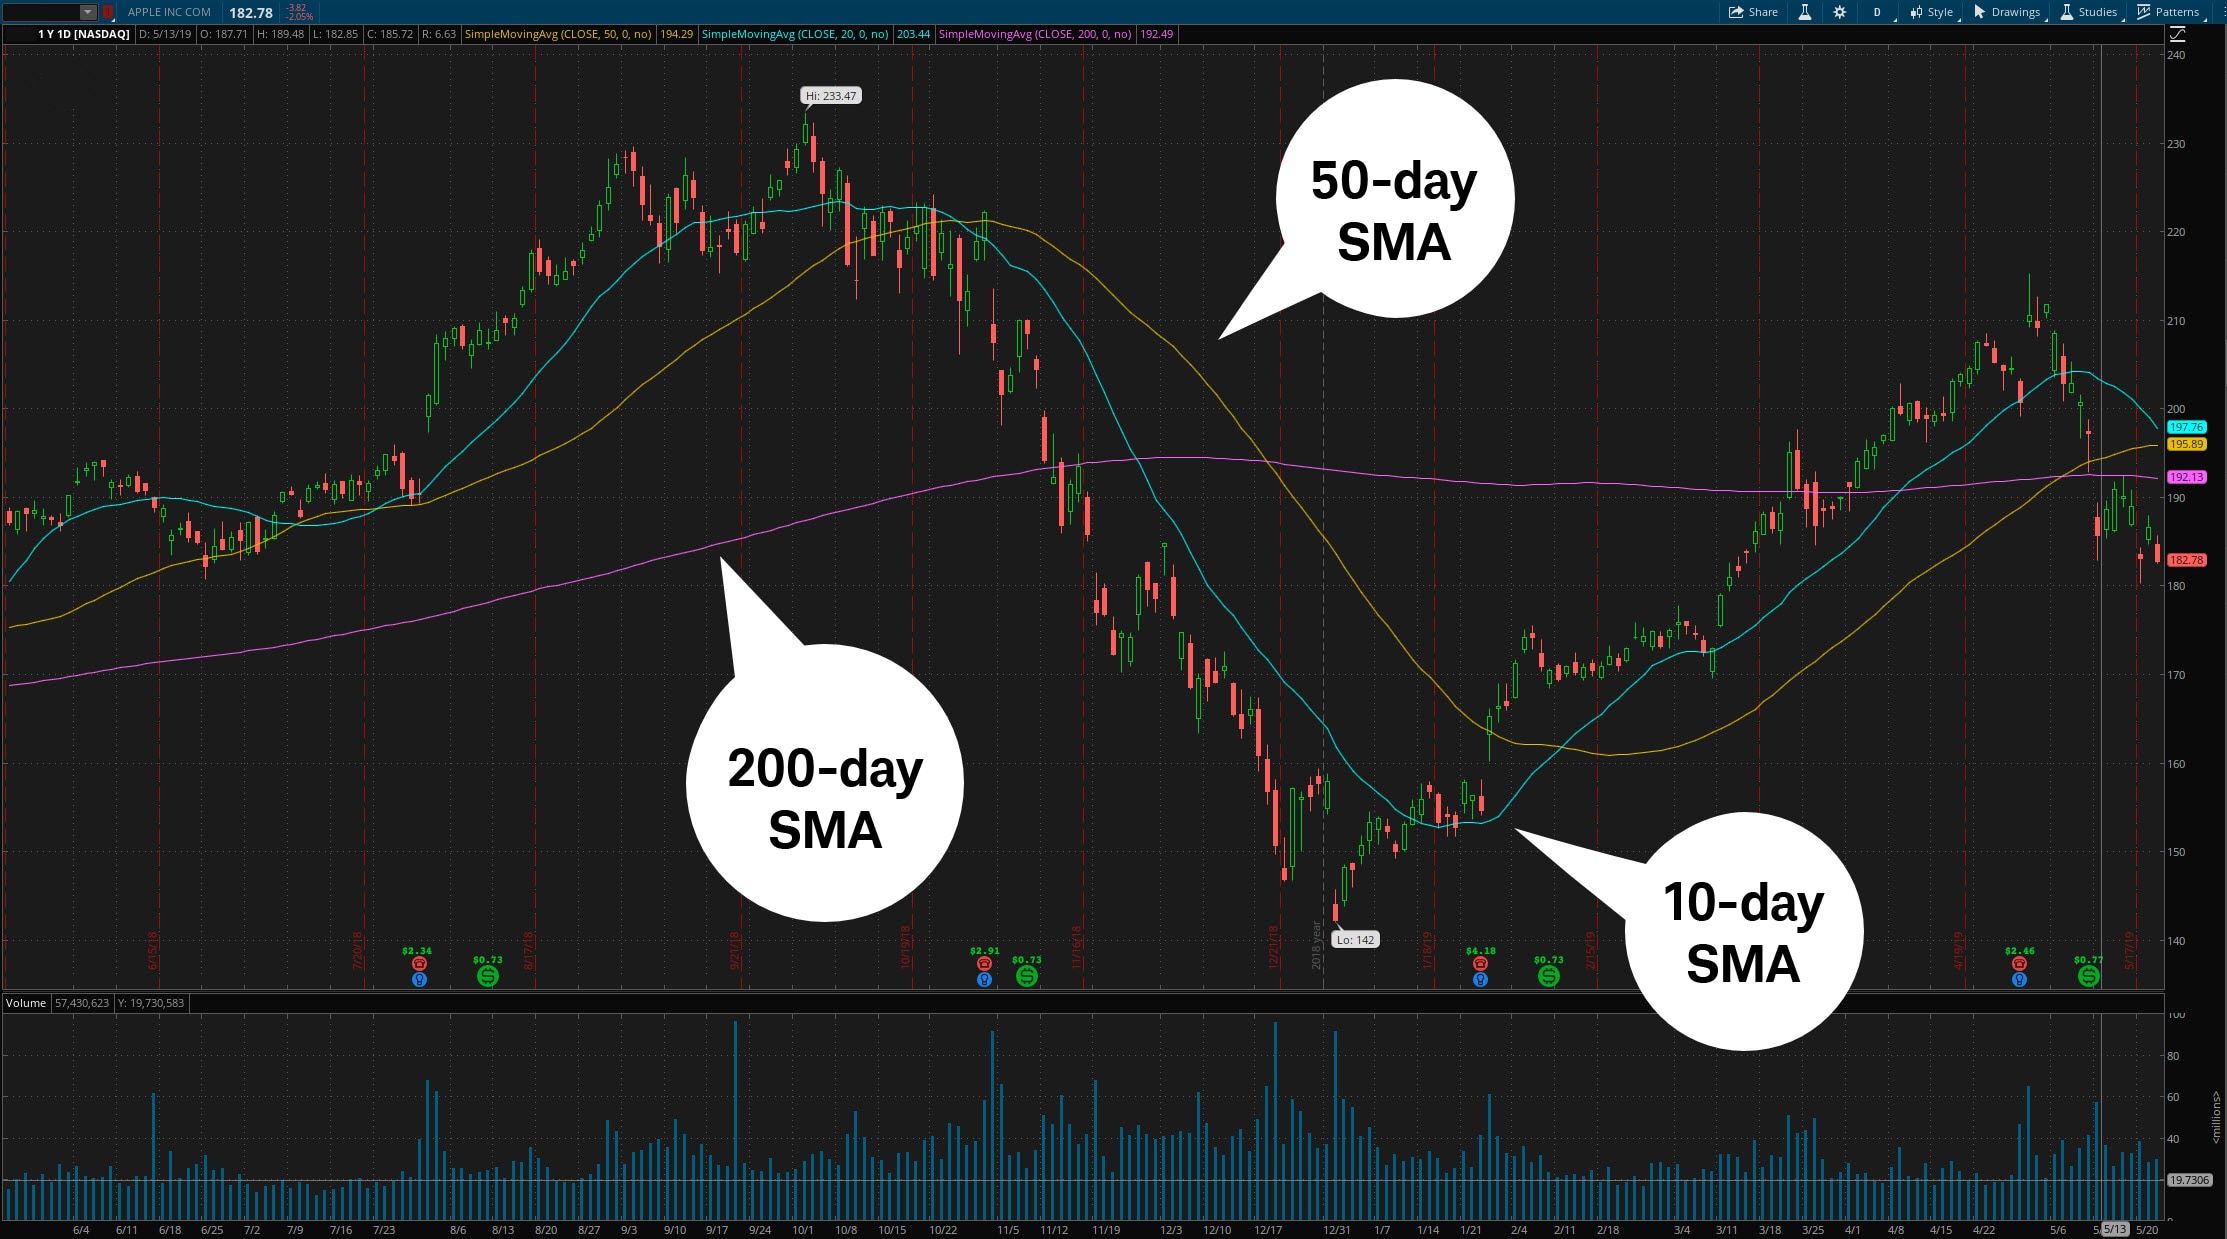
Source: thinkorswim® platform
For illustrative purposes only. Past performance does not guarantee future results.
Understanding time horizon
The time horizon plays an important role in a trading strategy. When determining entry and exit points for a trade, traders pay attention to time horizon based on how a long a trend is likely to last. For example:
- Short-term trend: A short-term trader may use the 10-day SMA to monitor the short-term trend. If a stock price is above the 10-day SMA, and the SMA is moving higher, then the short-term trend may be up (the opposite is true for a downtrend).
- Intermediate-term trend: If the stock is above the 50-day SMA, and the SMA is moving higher, then the intermediate-term trend is generally considered to be up.
- Long-term trend: If a stock is trading above the 200-day SMA, and the SMA is moving higher, the long-term trend is considered up. Generally, the 200-day SMA is seen as a proxy for the long-term trend (and it's the average often cited on TV business reports).
Using two moving averages to identify trends
When a trader has assessed their time horizon, the next step is to use the trend to determine when it might make sense to enter or exit a trade. This can be done by using two moving averages in what's known as a crossover.
To create an SMA crossover system, start by choosing a time horizon. For example, an intermediate-term approach could include 20-day and 50-day moving averages. When the shorter average (the 20-day MA in this case) crosses above the longer average, that often signals a stronger likelihood of an uptrend. Some traders might take this as a potential buy signal.
On the other hand, when the shorter MA crosses below its longer counterpart, that may signal that an uptrend may be ending or perhaps even reversing to the downside. Some traders might take this as a signal to sell their positions.
A potential advantage to using two moving averages is to help verify or confirm a signal. With just one MA, a buy signal might be triggered whenever a stock's closing price moves above it. This signal may or may not be valid. When markets get choppy, price can close above and below an MA in frequent succession. This can make it difficult to identify entry and exit points traders might find helpful. The SMA crossover technique can potentially help traders avoid false signals and whipsaw moves.
Identifying the signals
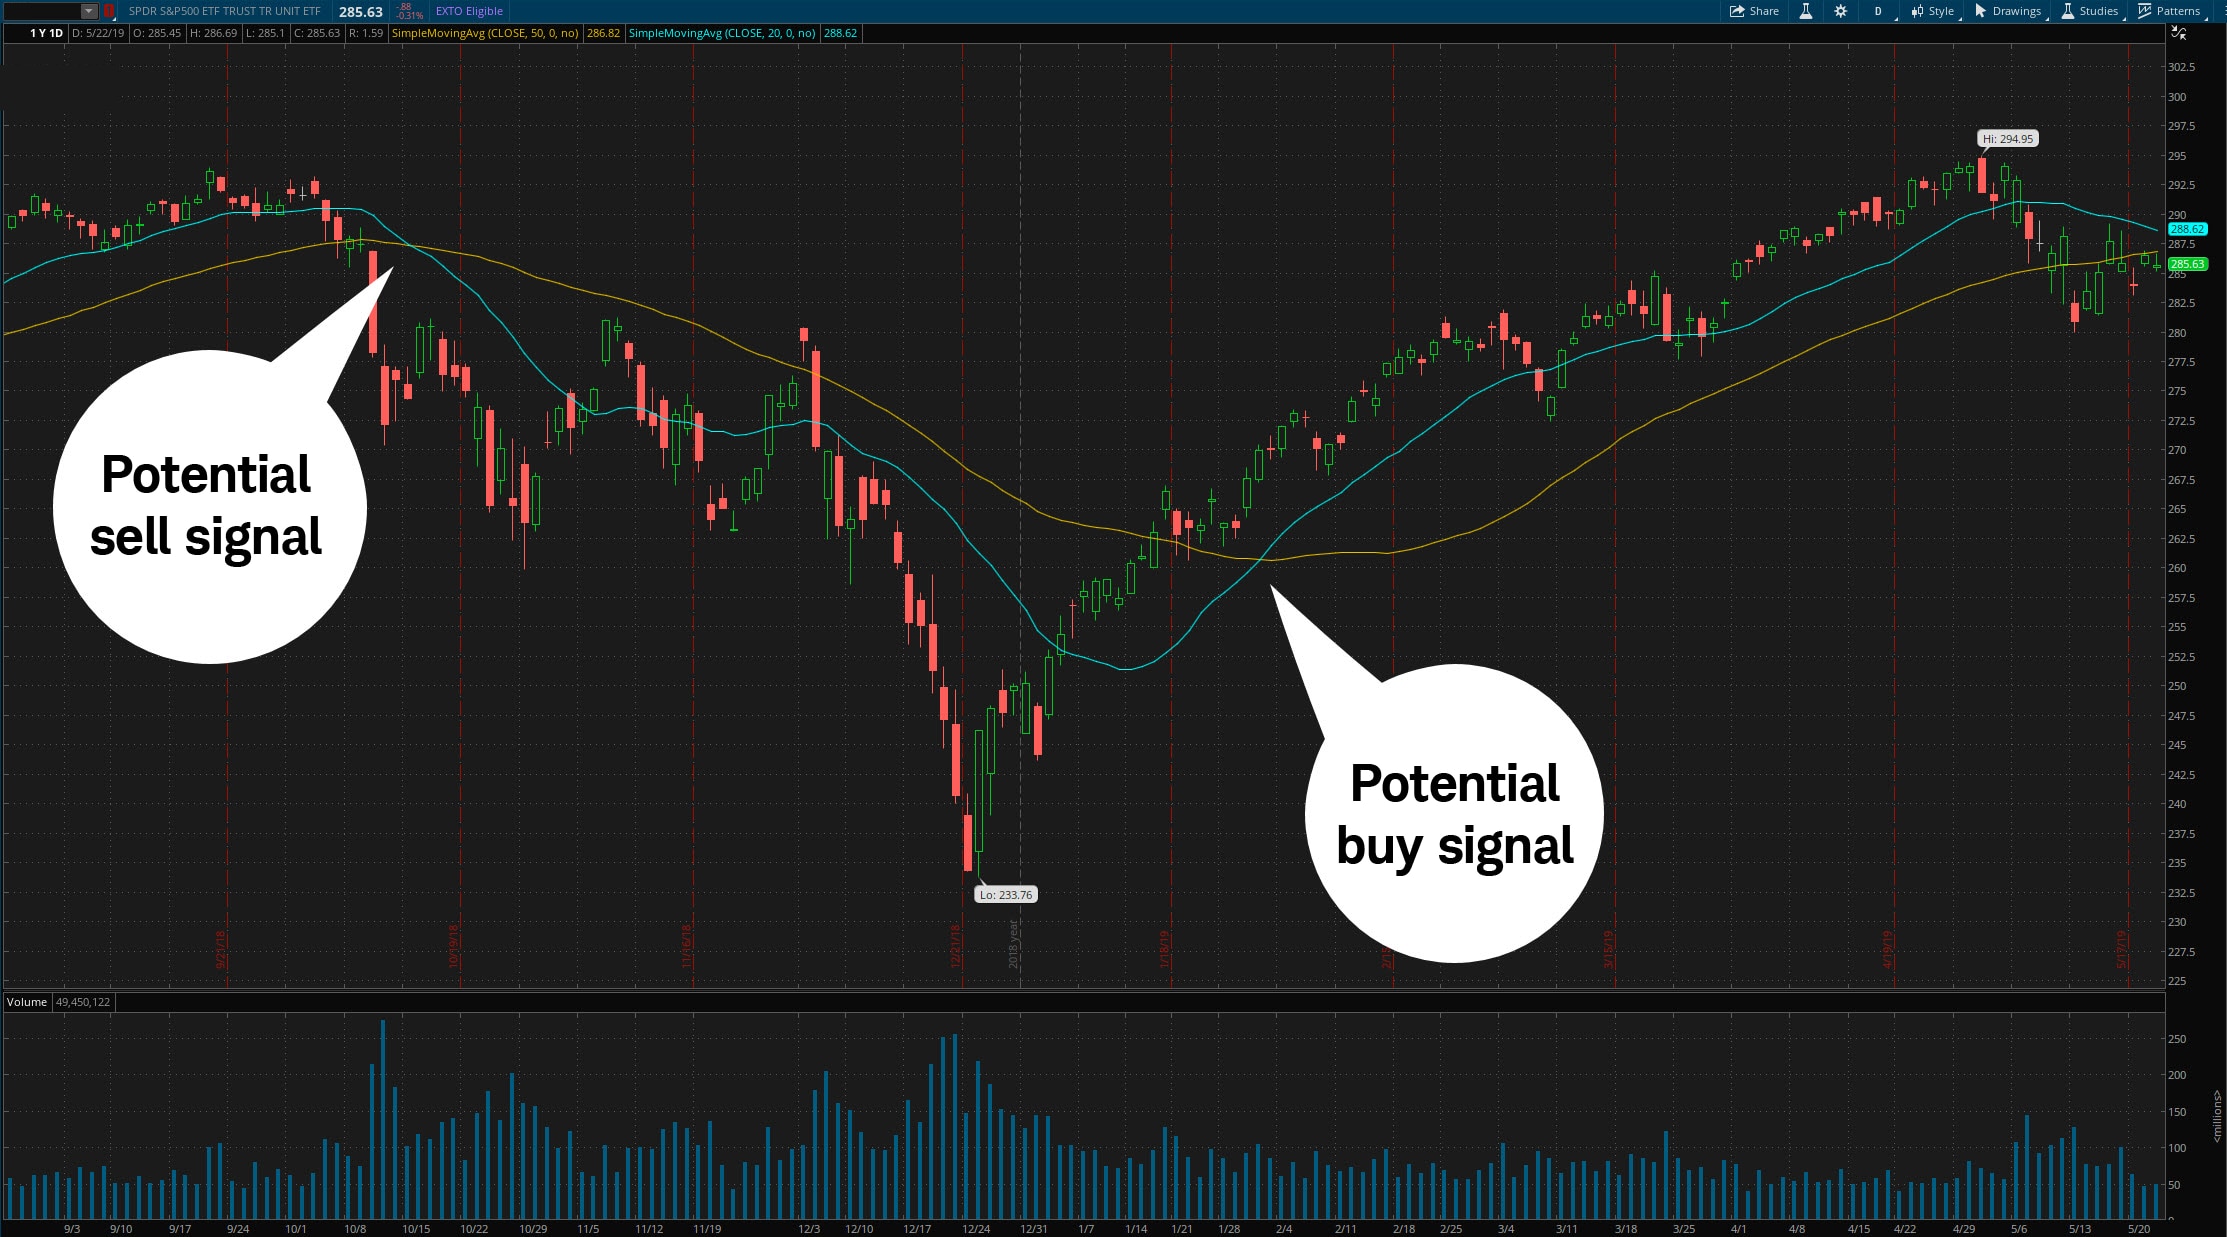
Source: thinkorswim platform
For illustrative purposes only.
Look for confirmation
Confirmation is often considered a basic tenet of technical analysis3. Generally, no indicator or chart pattern stands alone. As a result, traders might want to use the SMA crossover technique to find potential entry or exit signals in combination with other indicators, as illustrated in the chart below. A combination of indicators, such as support or resistance breakout points, volume readings, or other indicators that may match a given market scenario, can help provide confirmation.
SMA crossover combinations
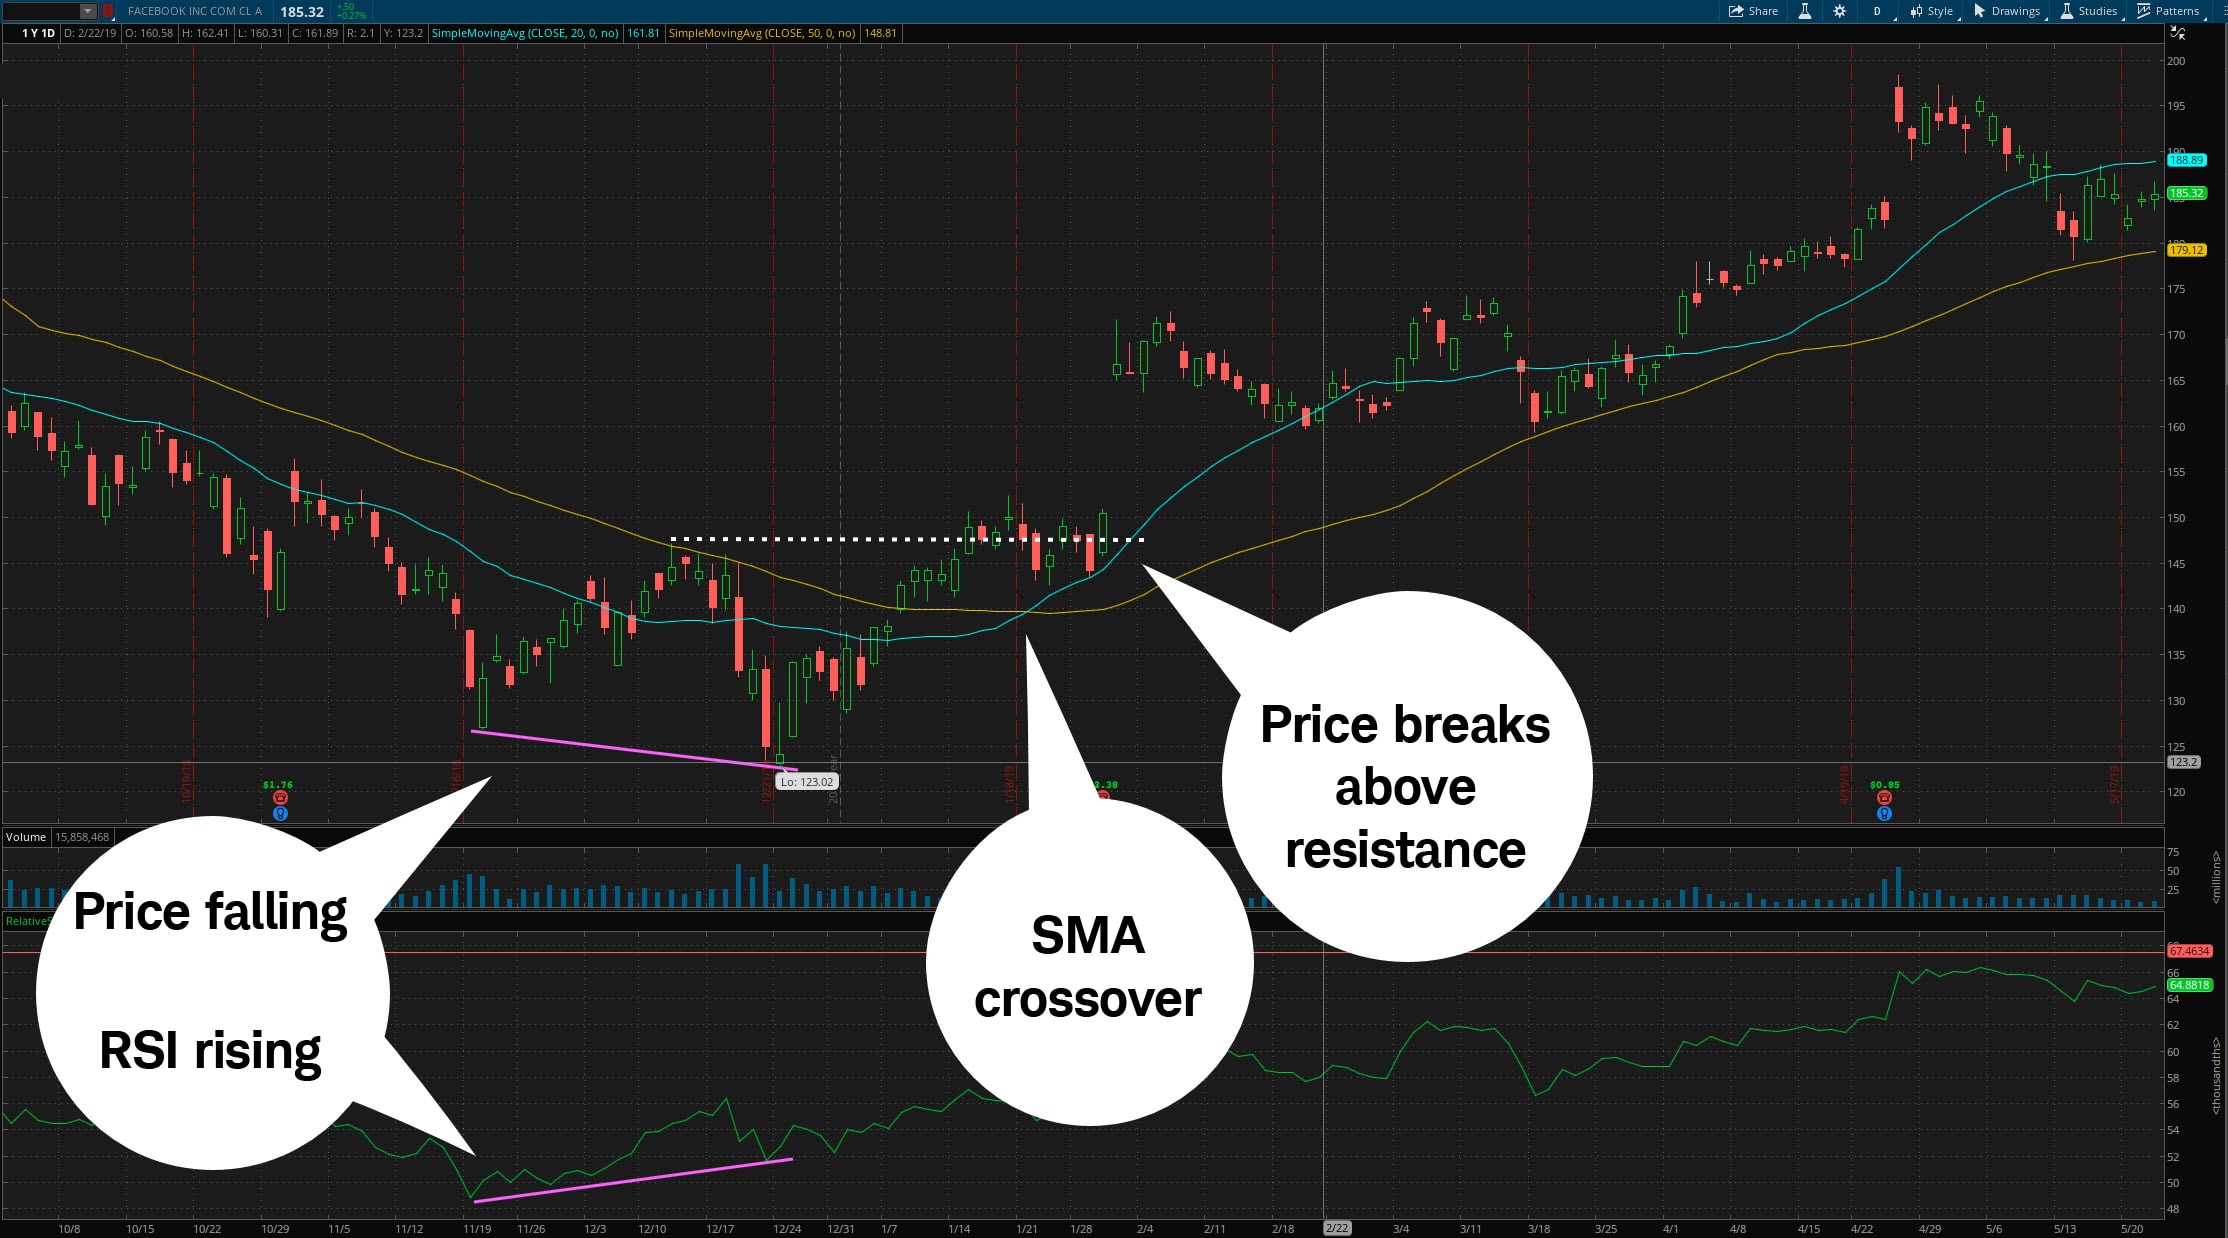
Source: thinkorswim platform
For illustrative purposes only.
Bottom line
SMA crossovers are potentially helpful in identifying when a trend might be emerging or when a trend might be ending. The SMA crossover system offers the potential to identify specific triggers for potential entry and exit points. However, these triggers should be confirmed with a chart pattern or resistance breakout along with supportive volume.
1A simple moving average (SMA) is a technical indicator that's calculated by adding the closing price of a stock or other security over a specific period of time and dividing the total by the appropriate number of trading days. For example, a 20-day SMA is the average closing price over the previous 20 days.
2A technical indicator that's calculated by adding the closing price of a stock or other security over a specific period of time and dividing the total by the appropriate number of trading days. For example, a 20-day moving average is the average closing price over the previous 20 days.
3Examines historical trading data, such as price and volume data, to identify previous chart patterns with the hope of anticipating stock price movements. Some technical analysis tools include moving averages, oscillators, and trendlines.
Schwab traders get in-depth research tools
More from Charles Schwab
Looking to the Futures
Today's Options Market Update
The Truth About Corporate Stock Earnings Estimates
Related topics
The information provided here is for general informational purposes only and should not be considered an individualized recommendation or personalized investment advice. The investment strategies mentioned here may not be suitable for everyone. Each investor needs to review an investment strategy for his or her own particular situation before making any investment decision.
All expressions of opinion are subject to change without notice in reaction to shifting market conditions. Data contained herein from third-party providers is obtained from what are considered reliable sources. However, its accuracy, completeness, or reliability cannot be guaranteed.
Examples provided are for illustrative purposes only and not intended to be reflective of results you can expect to achieve.
0723-3KDT